
How to Create a Stellar Social Media Report (+ Free Templates)
Learn how to create impactful social media reports that demonstrate ROI and guide strategy with our step-by-step guide and free templates.
April 7, 2025
Effective social media reports transform raw data and vanity metrics into strategic insights that prove ROI and guide future campaigns.
This guide shows you what to include in your reports, which metrics to track, and how to present results to impress stakeholders at every level.
You'll learn a step-by-step process for creating reports that connect social activities to business goals and help you demonstrate the true value of your social media efforts.
Need more context? Grab this free social media reporting template and follow along.
What is a social media report?
A social media report compiles data from your social channels to show performance over a defined period. It can track specific campaigns, time periods, channels, objectives, etc.
Effective social media reports help explore the real impact of your social media efforts. They contextualize data, highlight patterns, and connect social activities to business outcomes.
A social media report might include:
Key social media metrics across platforms (reach, engagement, clicks)
Platform-by-platform breakdown of social media performance
Visual data representations and summaries
Content effectiveness analysis and benchmarks
Audience growth and demographic insights
Strategic recommendations for improvement
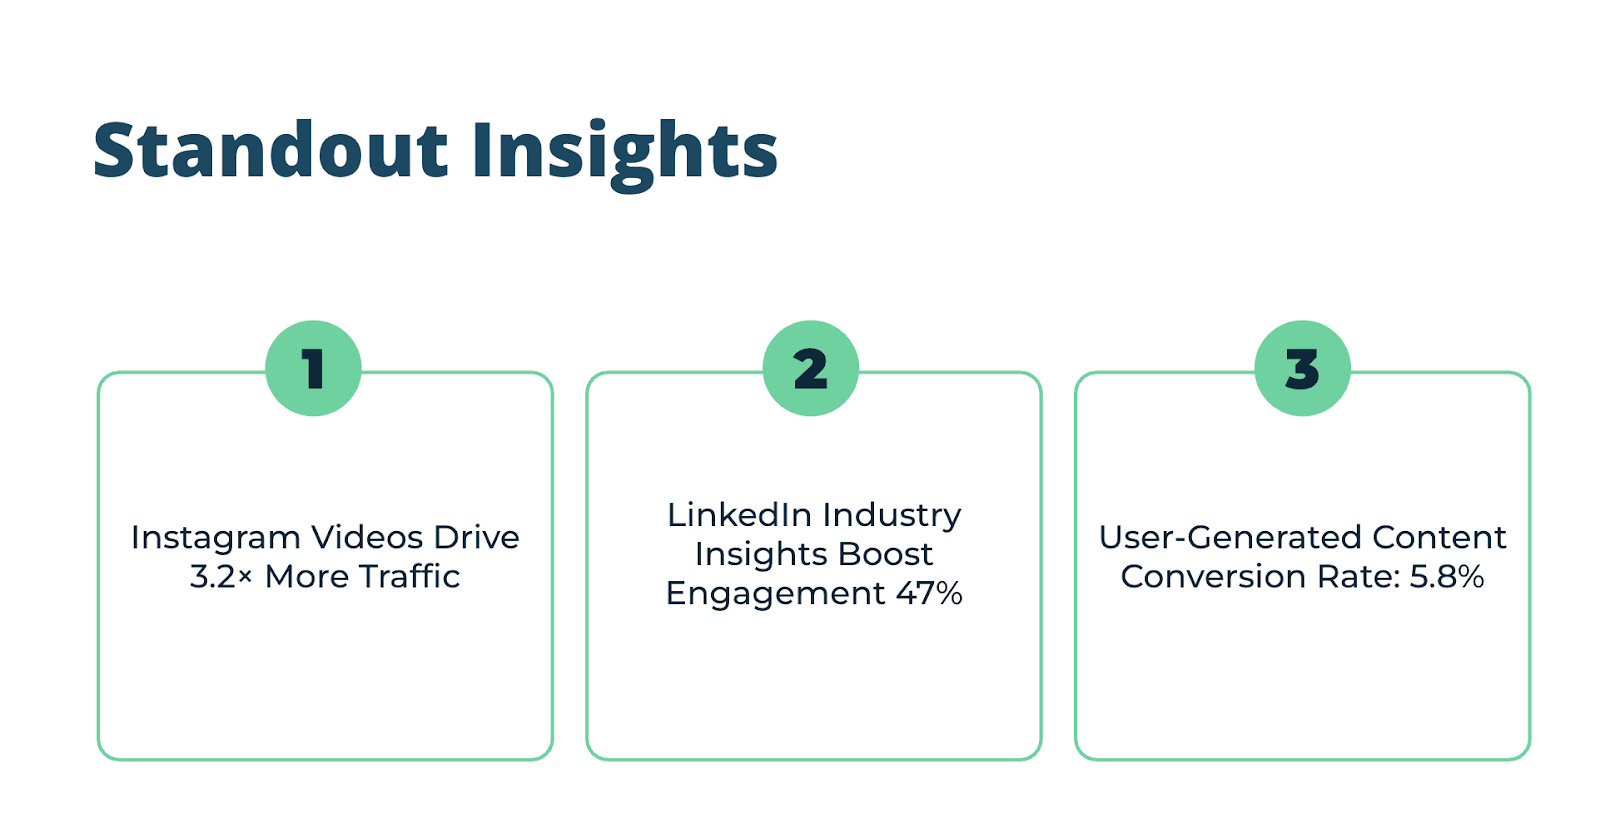
For example, a monthly report might reveal that video content on Instagram drives 3x more website traffic than static posts, giving you clear direction for content creation.
Or it might show that your LinkedIn engagement has increased significantly since you began posting industry insights, validating your content strategy shift.
What to include in your social media report?
First things first: start by defining the objectives of your social media report.
Is it to showcase your monthly progress, demonstrate the results of your latest campaign, or research trends in the industry?
Depending on this, your report can include various elements.
Executive summary
Start with an overview that connects social media activities to business goals.
This summary helps stakeholders quickly understand your social media performance and sets the context for the detailed metrics that follow.
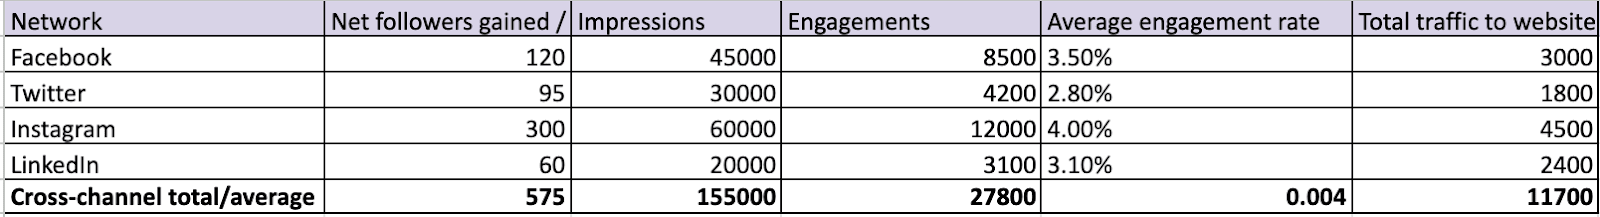
Include the most important data points connected to your original goals—e.g., follower growth, traffic, and engagement.
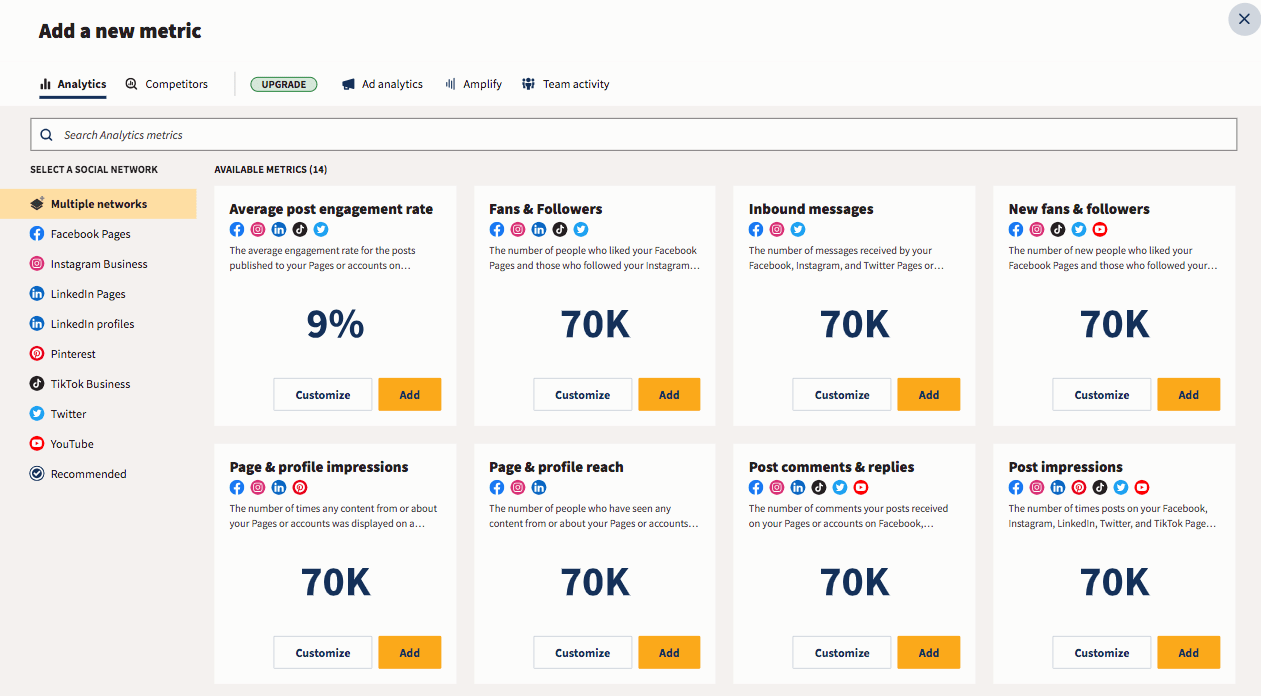
To gather this data, export performance metrics from each platform's analytics dashboard or use a social media analytics tool that consolidates data across channels.
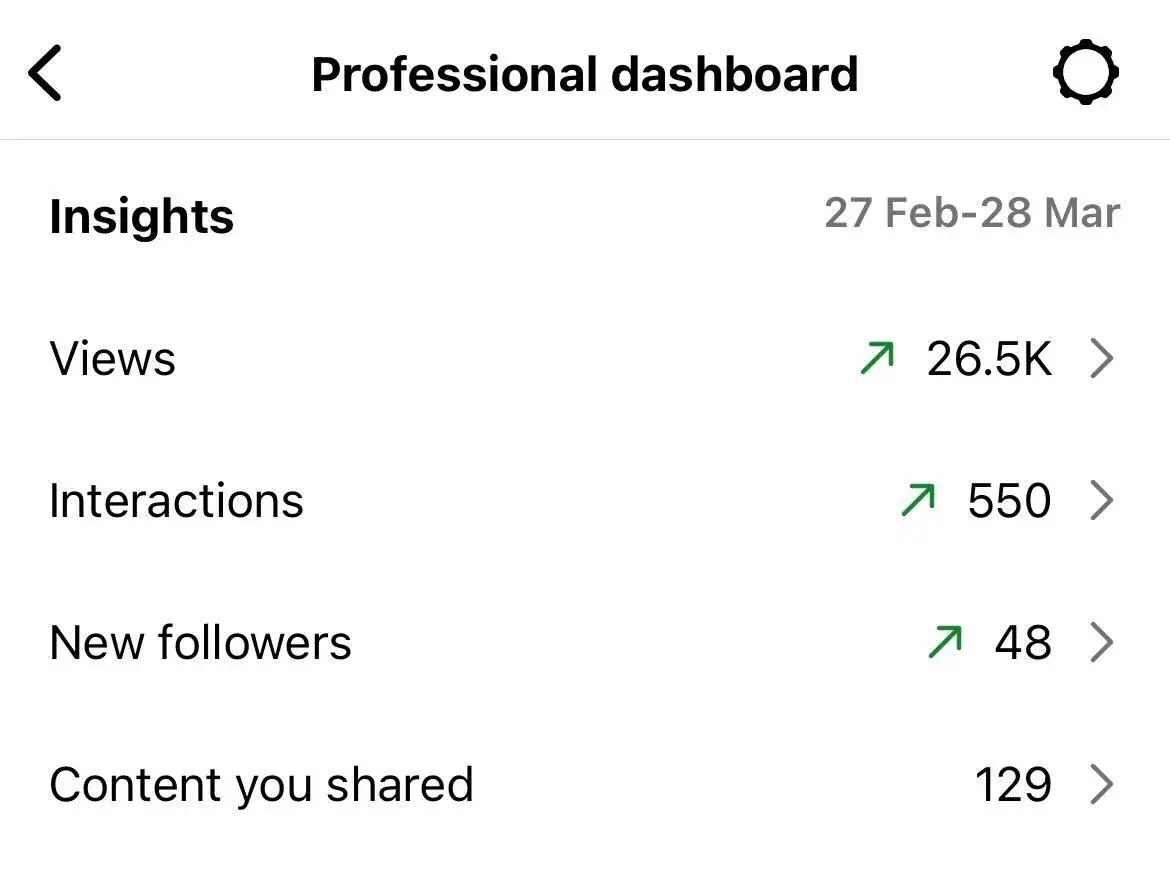
Here’s what it looks like in
also provide deeper insights about your audience profile, including preferences, location, demographics, and more.__CONTENTFUL_MEDIA_5__
Key metrics:
Net new followers by platform and follower count
Audience demographics shifts
Follower growth percentage by channel
Audience quality indicators (genuine vs. fake followers and relevance to your target profile)
Engagement metrics
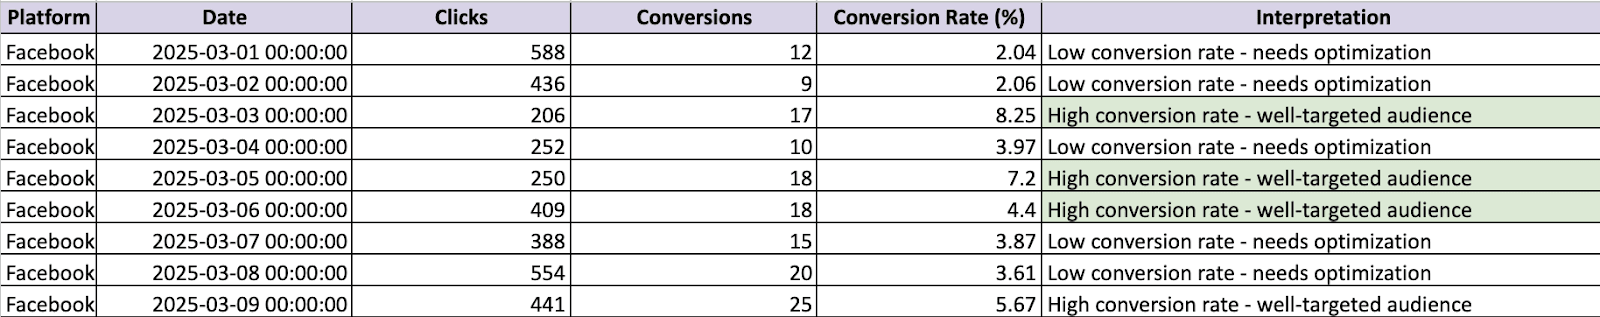
These social media metrics measure how effectively your content resonates with your audience. They also help you identify what content types and topics drive meaningful interaction.
To track engagement, analyze data from each social media platform and try to organize it by content topic and posting time to identify patterns.
For instance, you can check interaction metrics on Instagram:
Tools like Hootsuite and Talkwalker also offer ready-to-use reports showing cross-platform engagement, saving you a lot of time.
Key metrics:
Overall engagement rate per channel
Comment-to-like ratio on key posts
Video completion rates and drop-off points
Engagement distribution by time of day and day of week
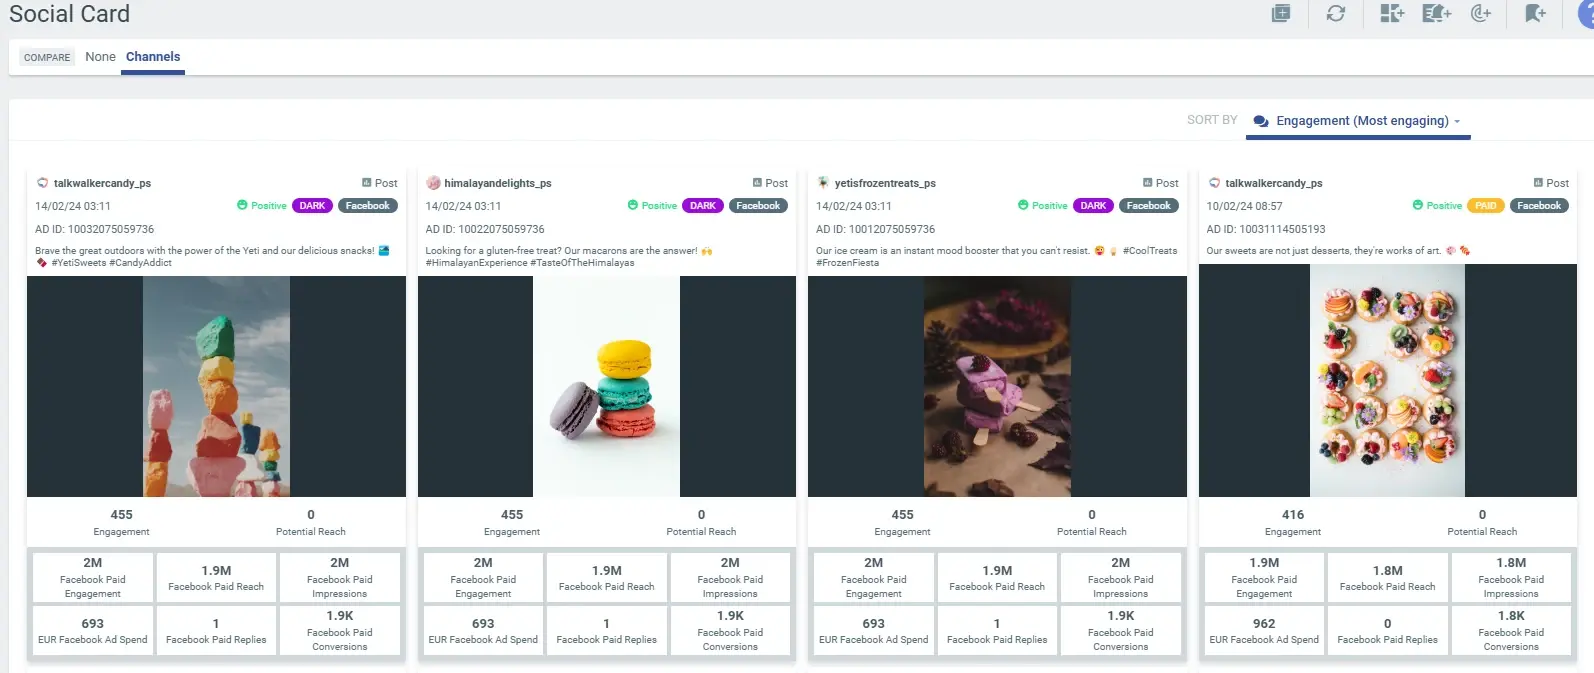
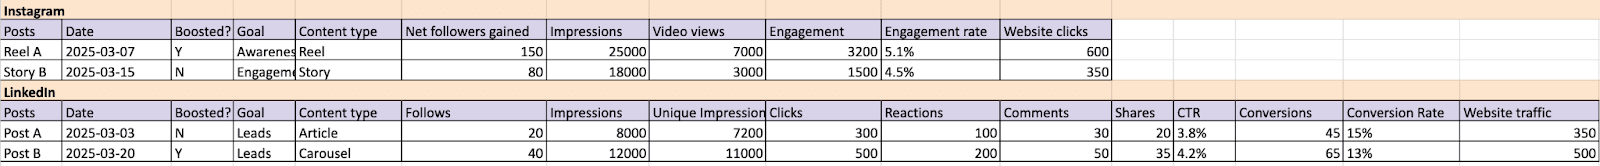
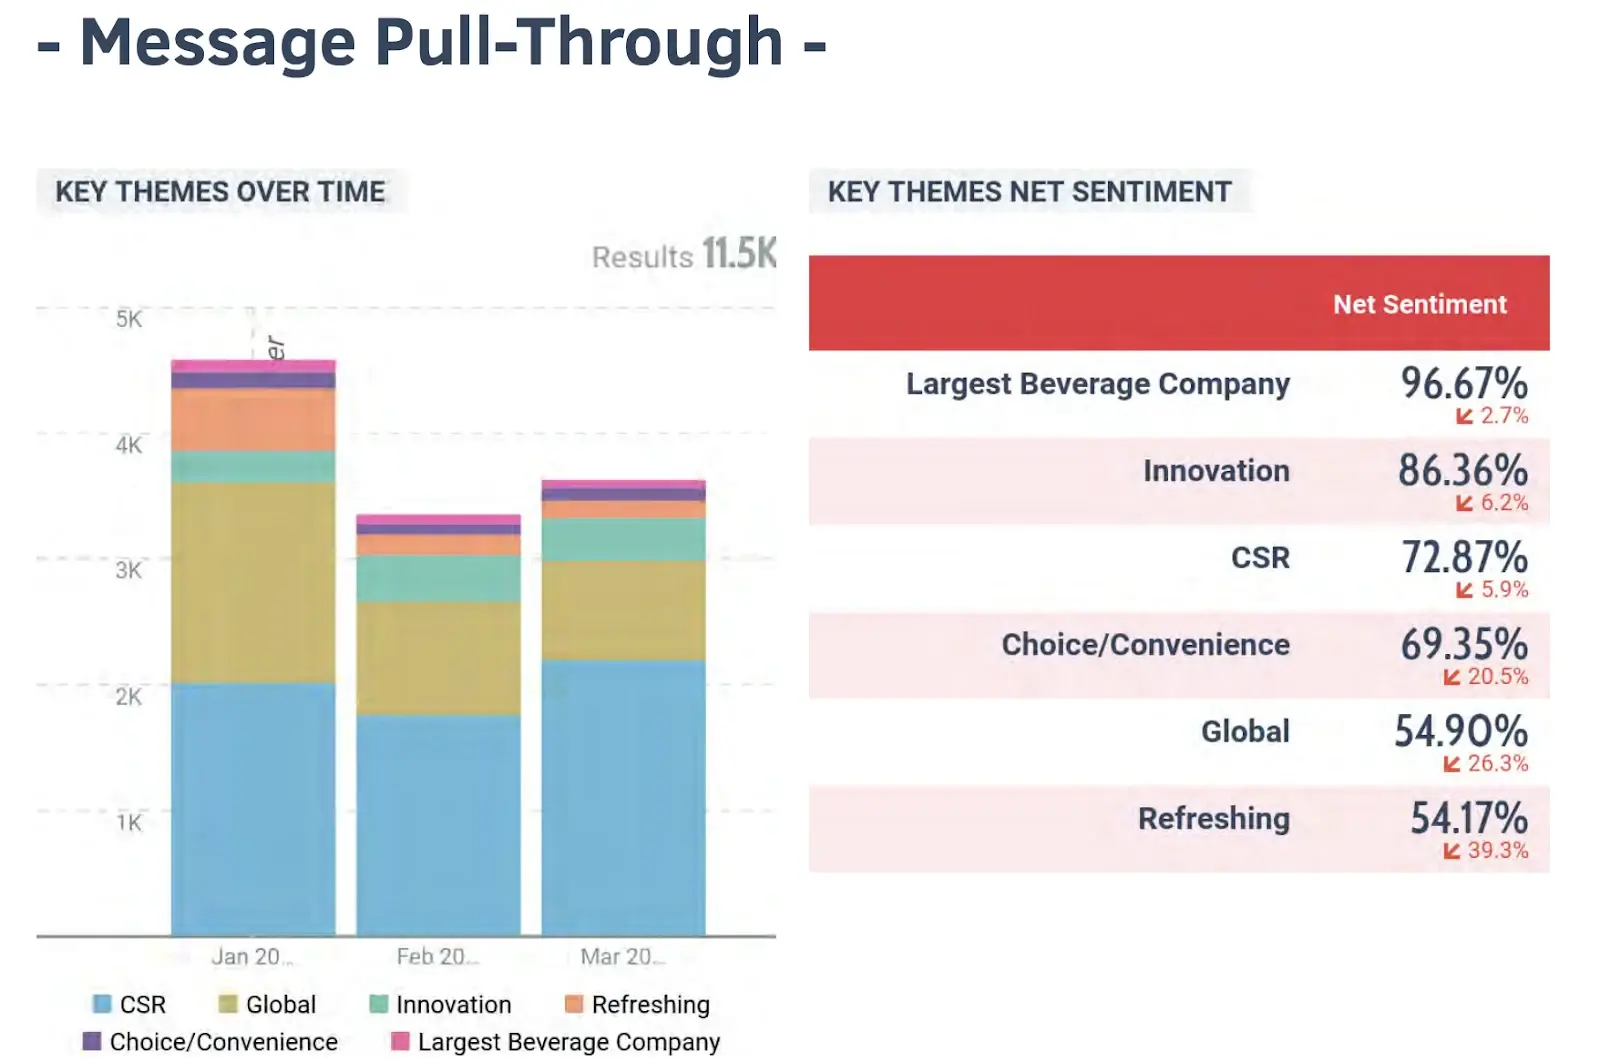
Content performance analysis
From here, determine which content types, formats, and topics generate the most reach, engagement and conversions. This helps you refine your content strategy and optimize resources.
To analyze content performance, categorize your posts by format, topic, and goal, then compare engagement and conversion metrics across these categories.
You can also use pre-populated post performance reports in your analytics tool.
Key metrics:
Performance by content category and format
Top-performing posts and their characteristics
Optimal posting times and frequencies
Hashtag effectiveness and reach
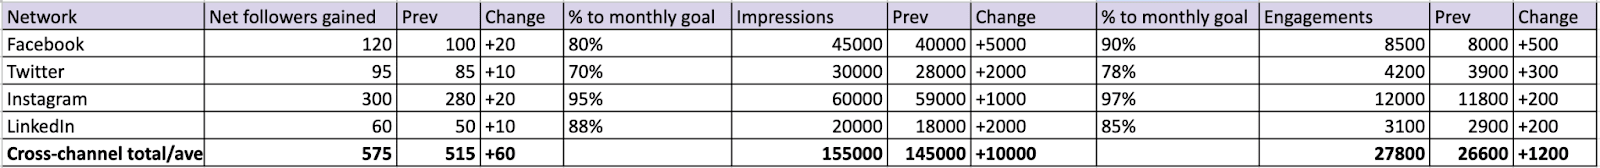
Channel performance
Next, analyze how each social media channel performs against your objectives to optimize your platform strategy. It’s a great way to allocate resources effectively across social networks.
To assess channel performance, compare engagement rates, conversion metrics, and audience growth across platforms against your specific goals for each channel.
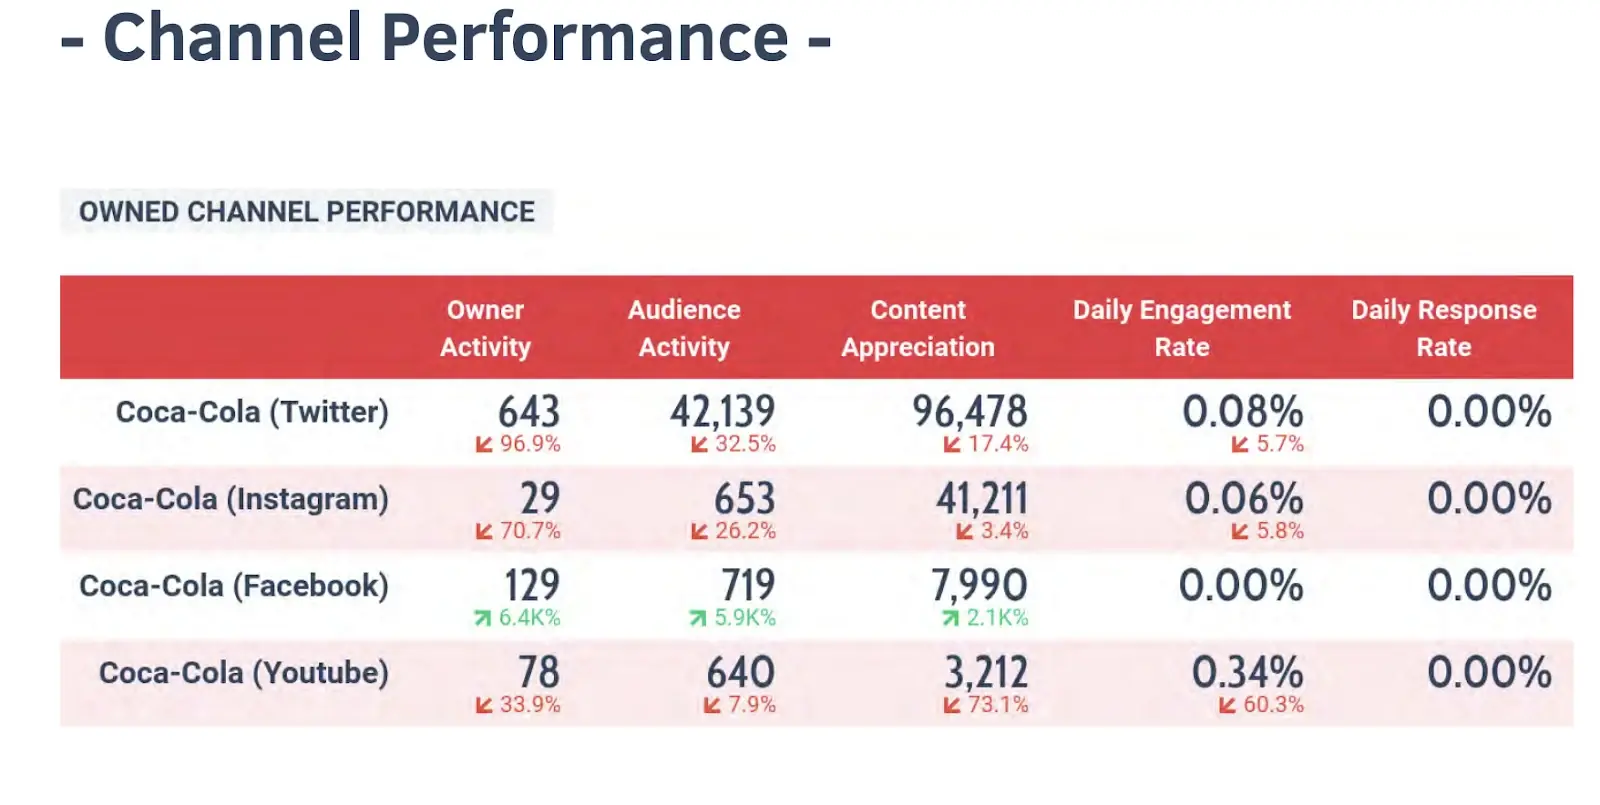
Key metrics:
Engagement rates by platform
Conversion metrics by channel
Content performance across platforms
Platform-specific audience growth
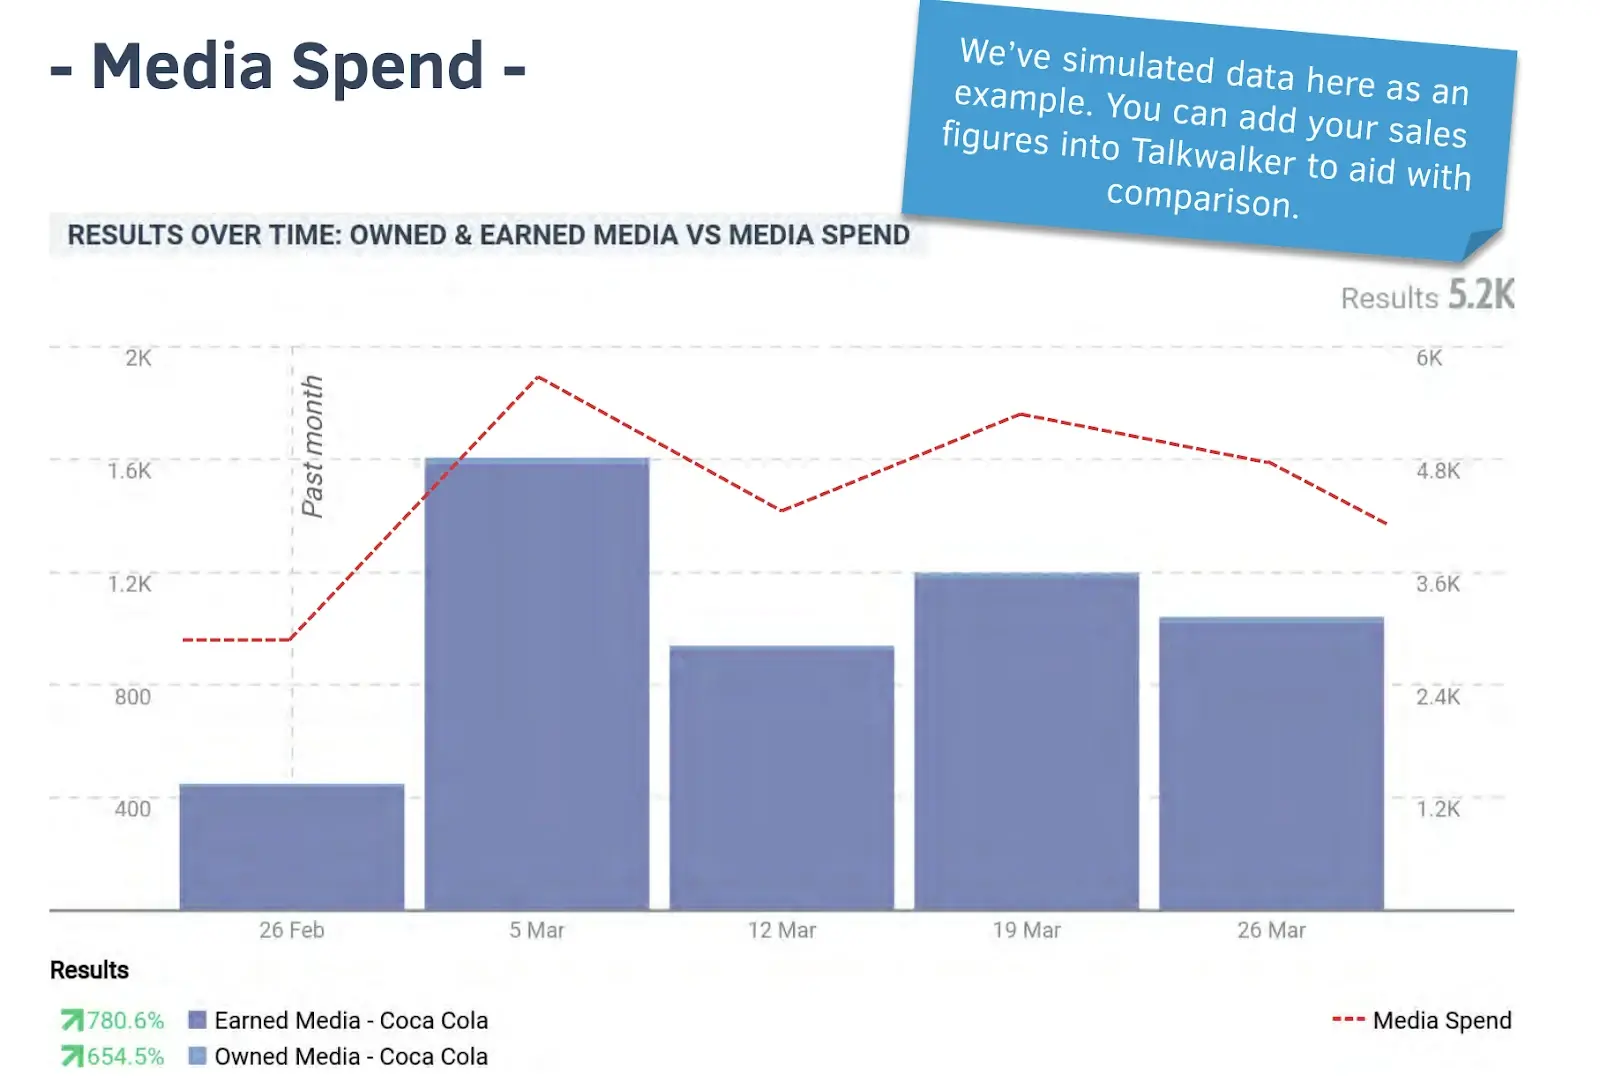
Traffic, conversions, and ROI
Finally, connect social media marketing to website traffic and business results. This report section demonstrates how your social media channels contribute to tangible outcomes.
To track conversions, use UTM parameters for all social links, set up event tracking in Google Analytics (GA4), and analyze traffic patterns in your web analytics platform.
You can also directly track social media ROI with tools like
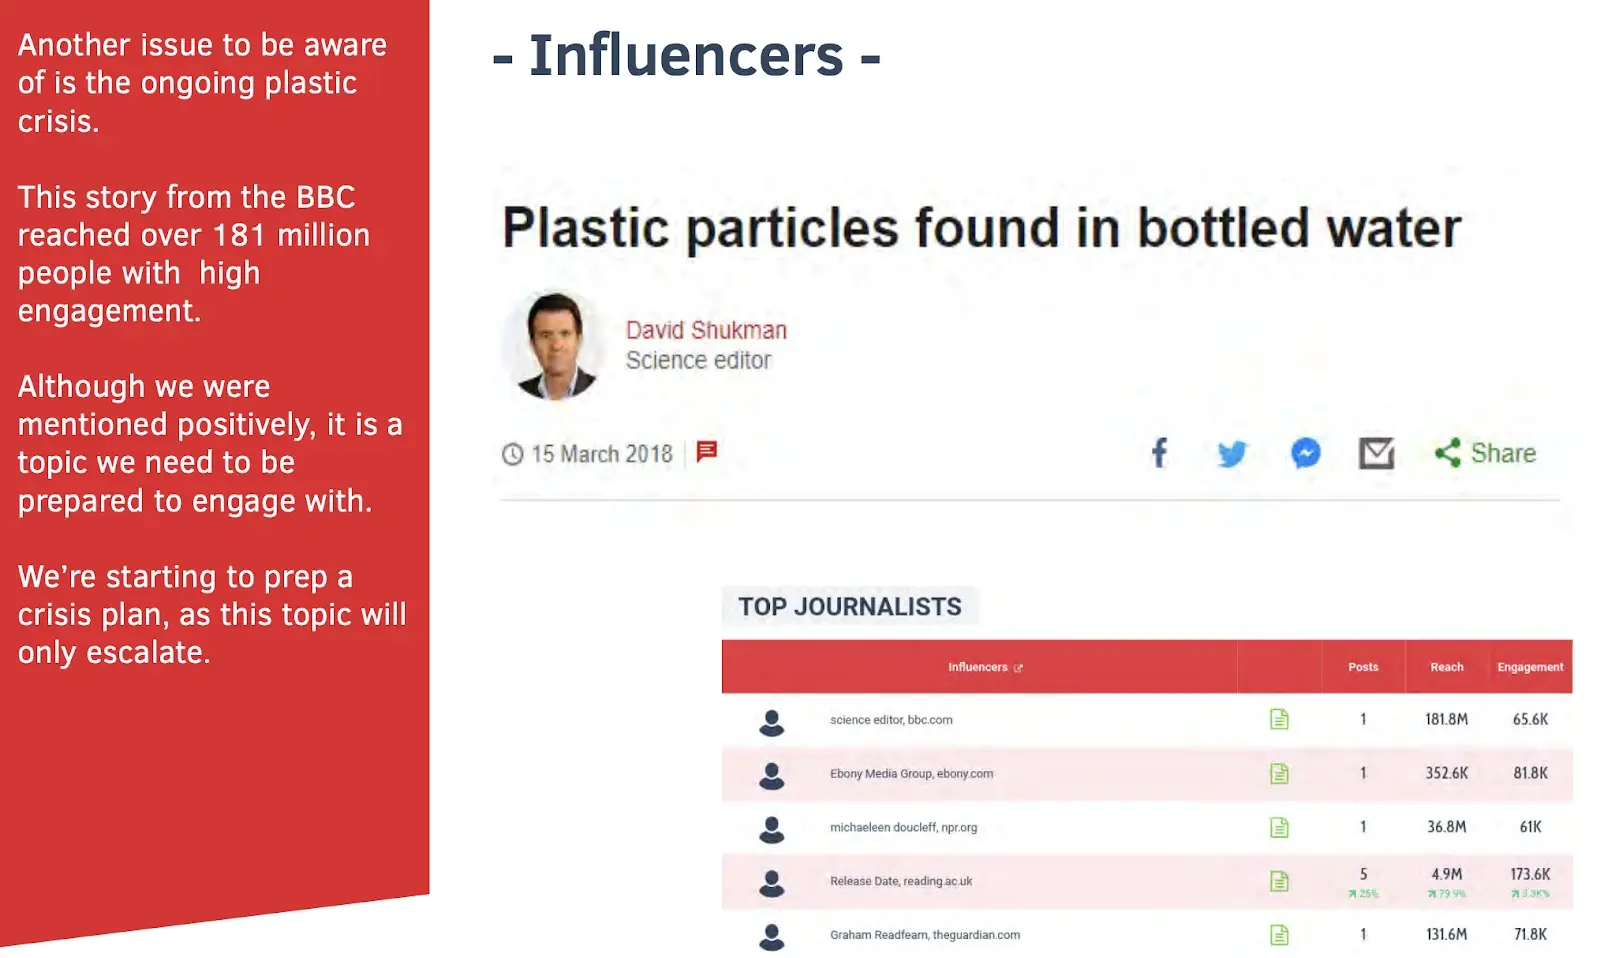
and compare your visibility to competitors. This helps you understand your brand awareness in the market, identify potential issues requiring attention, and even prevent social media crises.
To monitor mentions, use social listening tools or set up alerts for your brand name and relevant keywords (e.g., product-related).
Here’s what it looks like in Talkwalker:
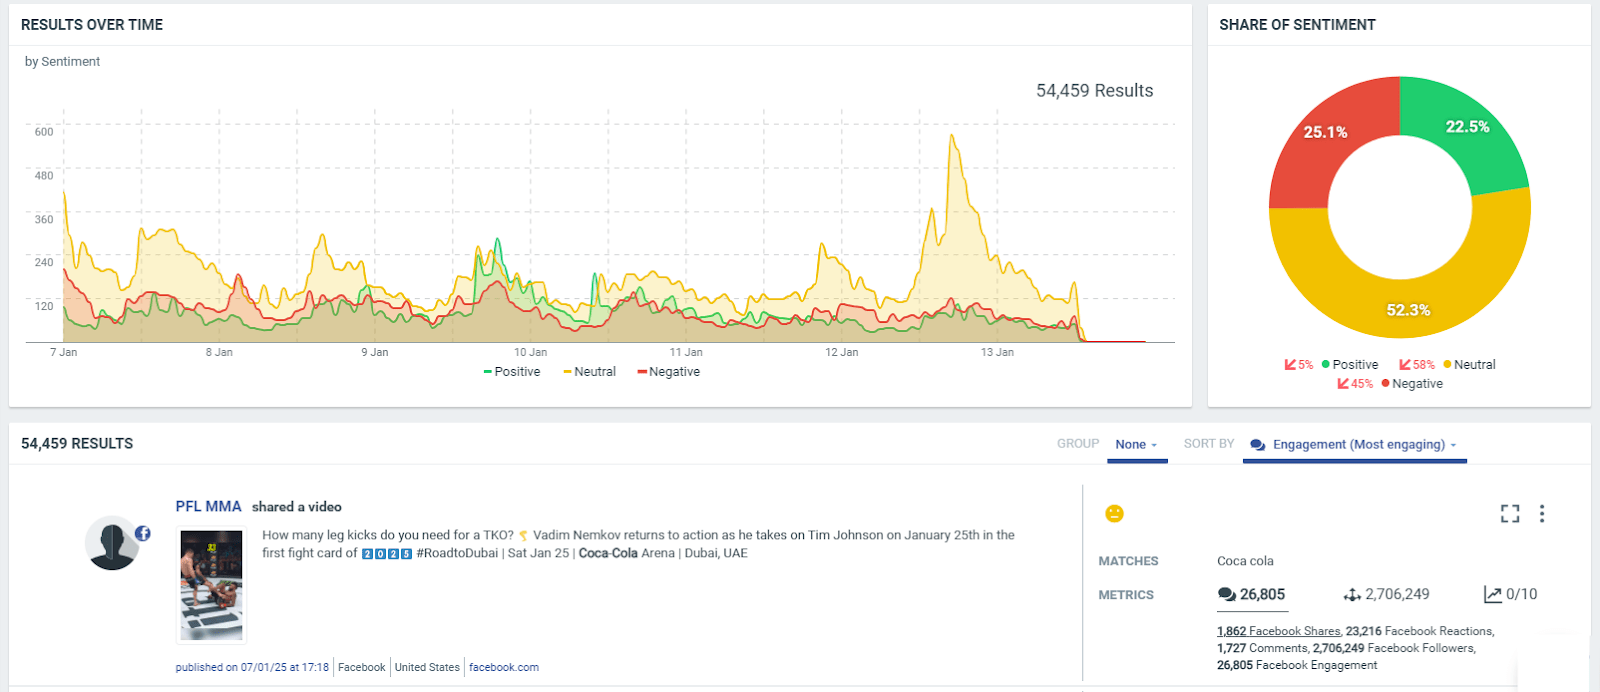
Key metrics:
Total brand mention volume with percentage change
Share of voice compared to competitors
Mention sentiment distribution
Most influential mention sources
Sentiment analysis
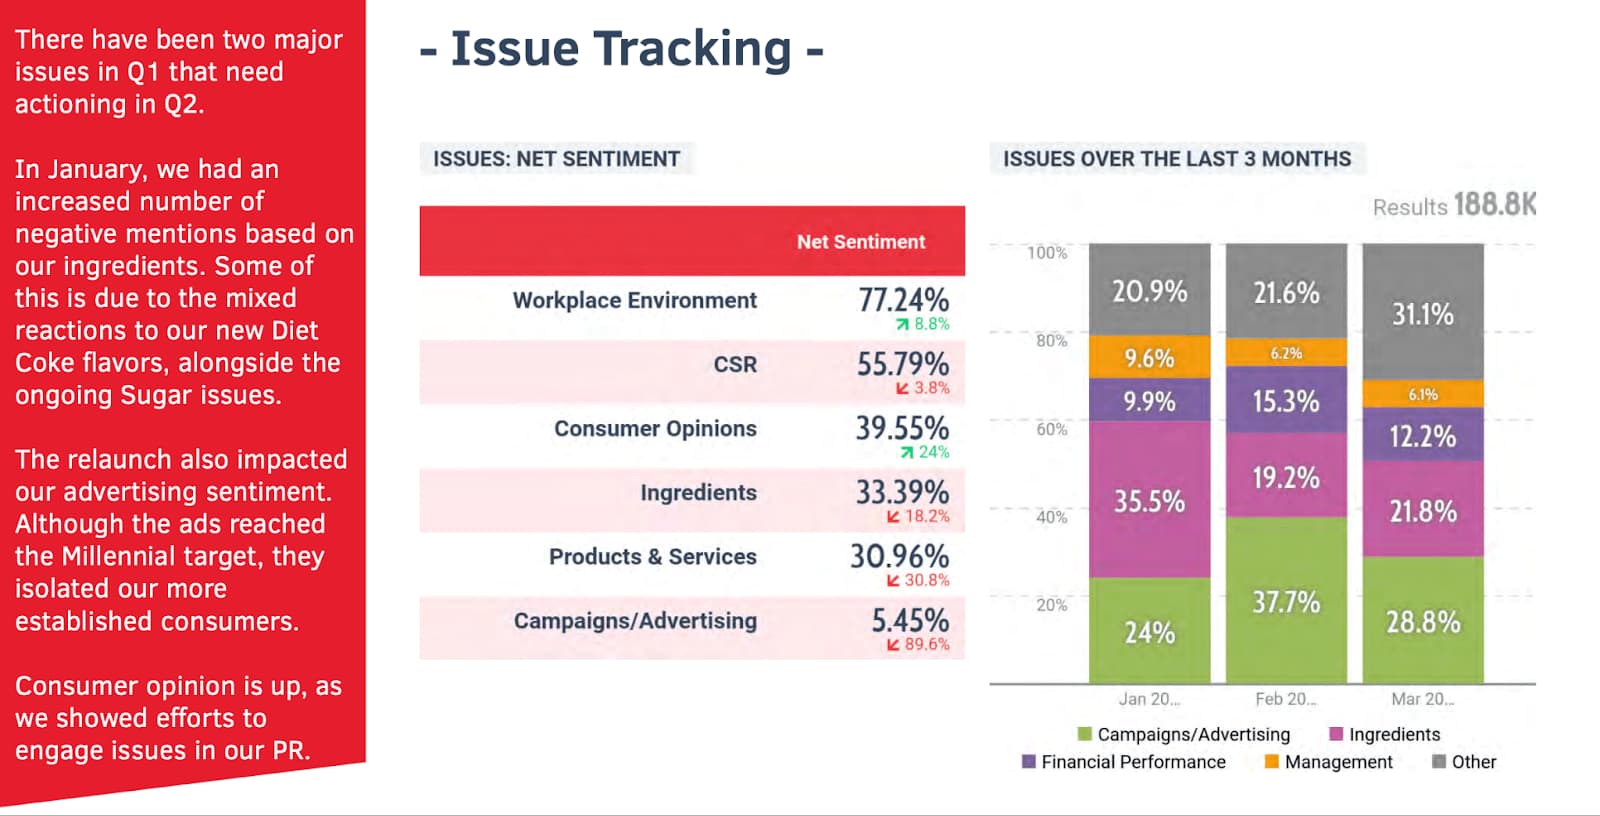
Sentiment analysis is another important item you might want to include in your social media report.
It analyzes how people feel about your brand based on social conversations. This insight is crucial for understanding public perception and identifying potential reputation issues.
To analyze sentiment, use AI-powered tools like Talkwalker that can categorize mentions as positive, negative, or neutral and track specific themes within those conversations.
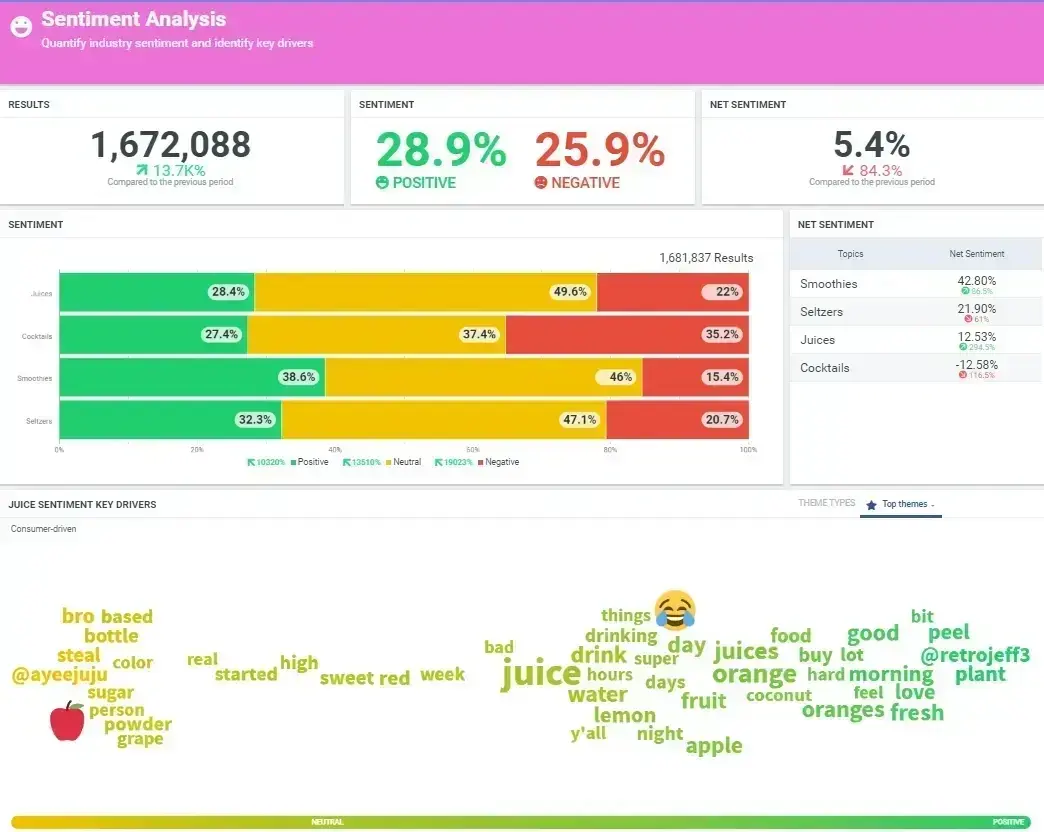
Key metrics:
Positive vs. negative mention ratio
Sentiment trends over time
Emotional response breakdown
Sentiment by product, feature, or campaign topic
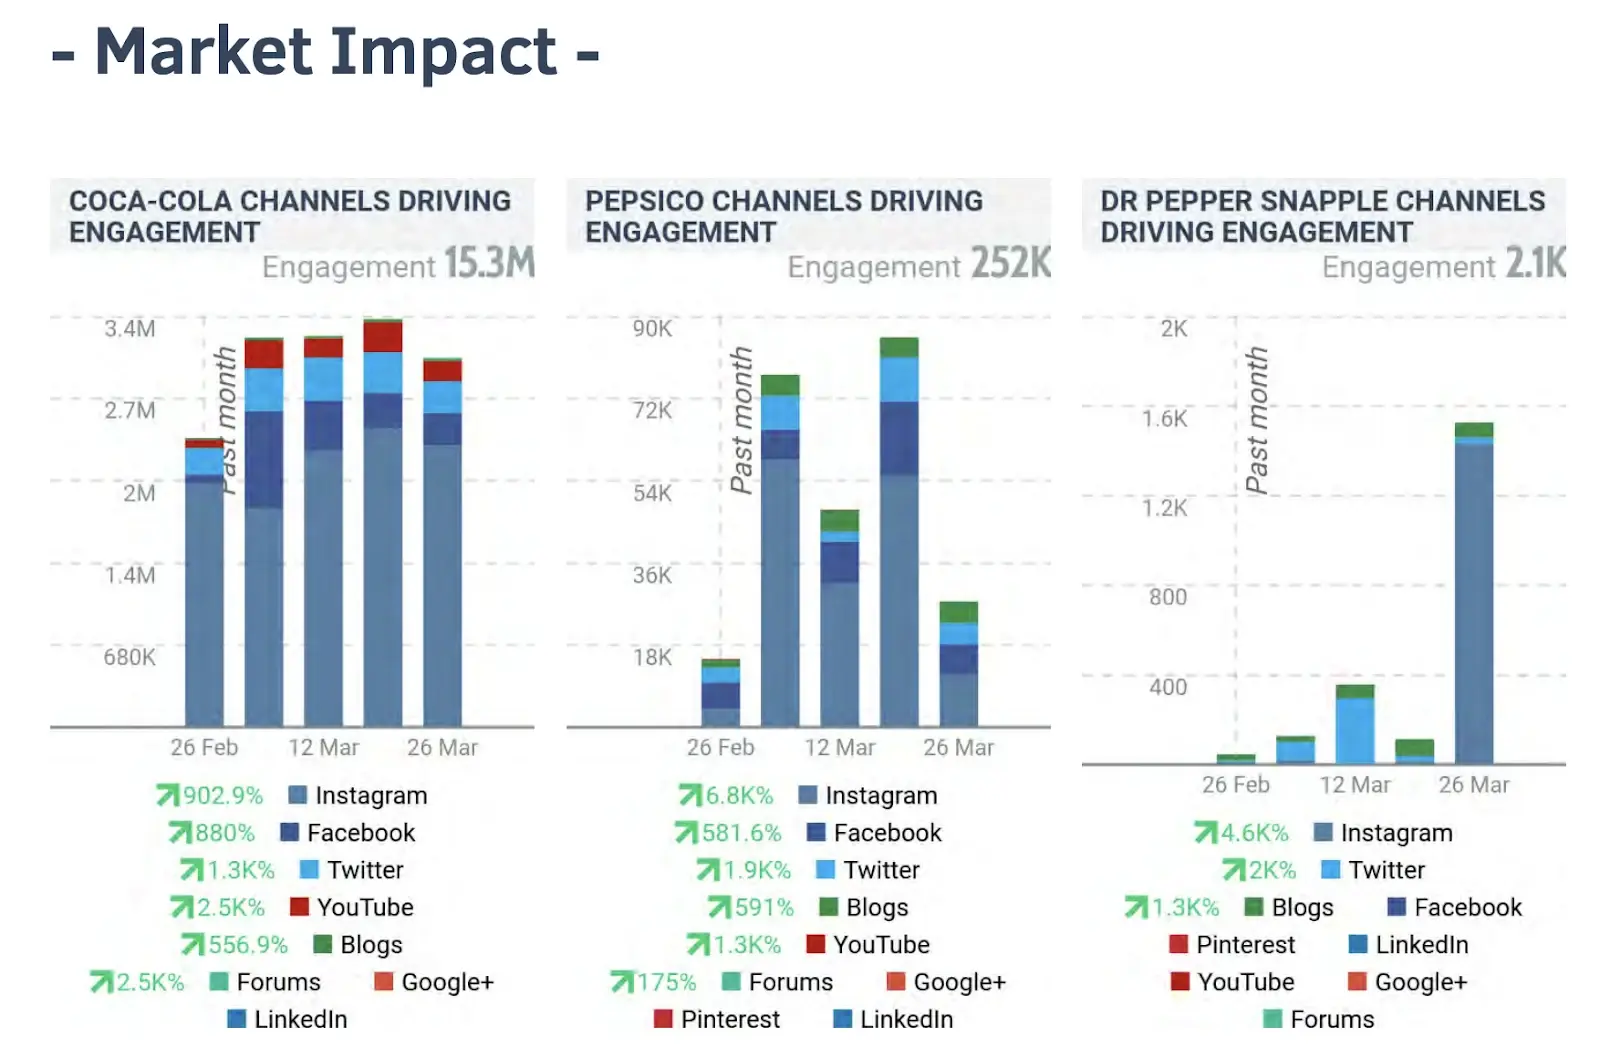
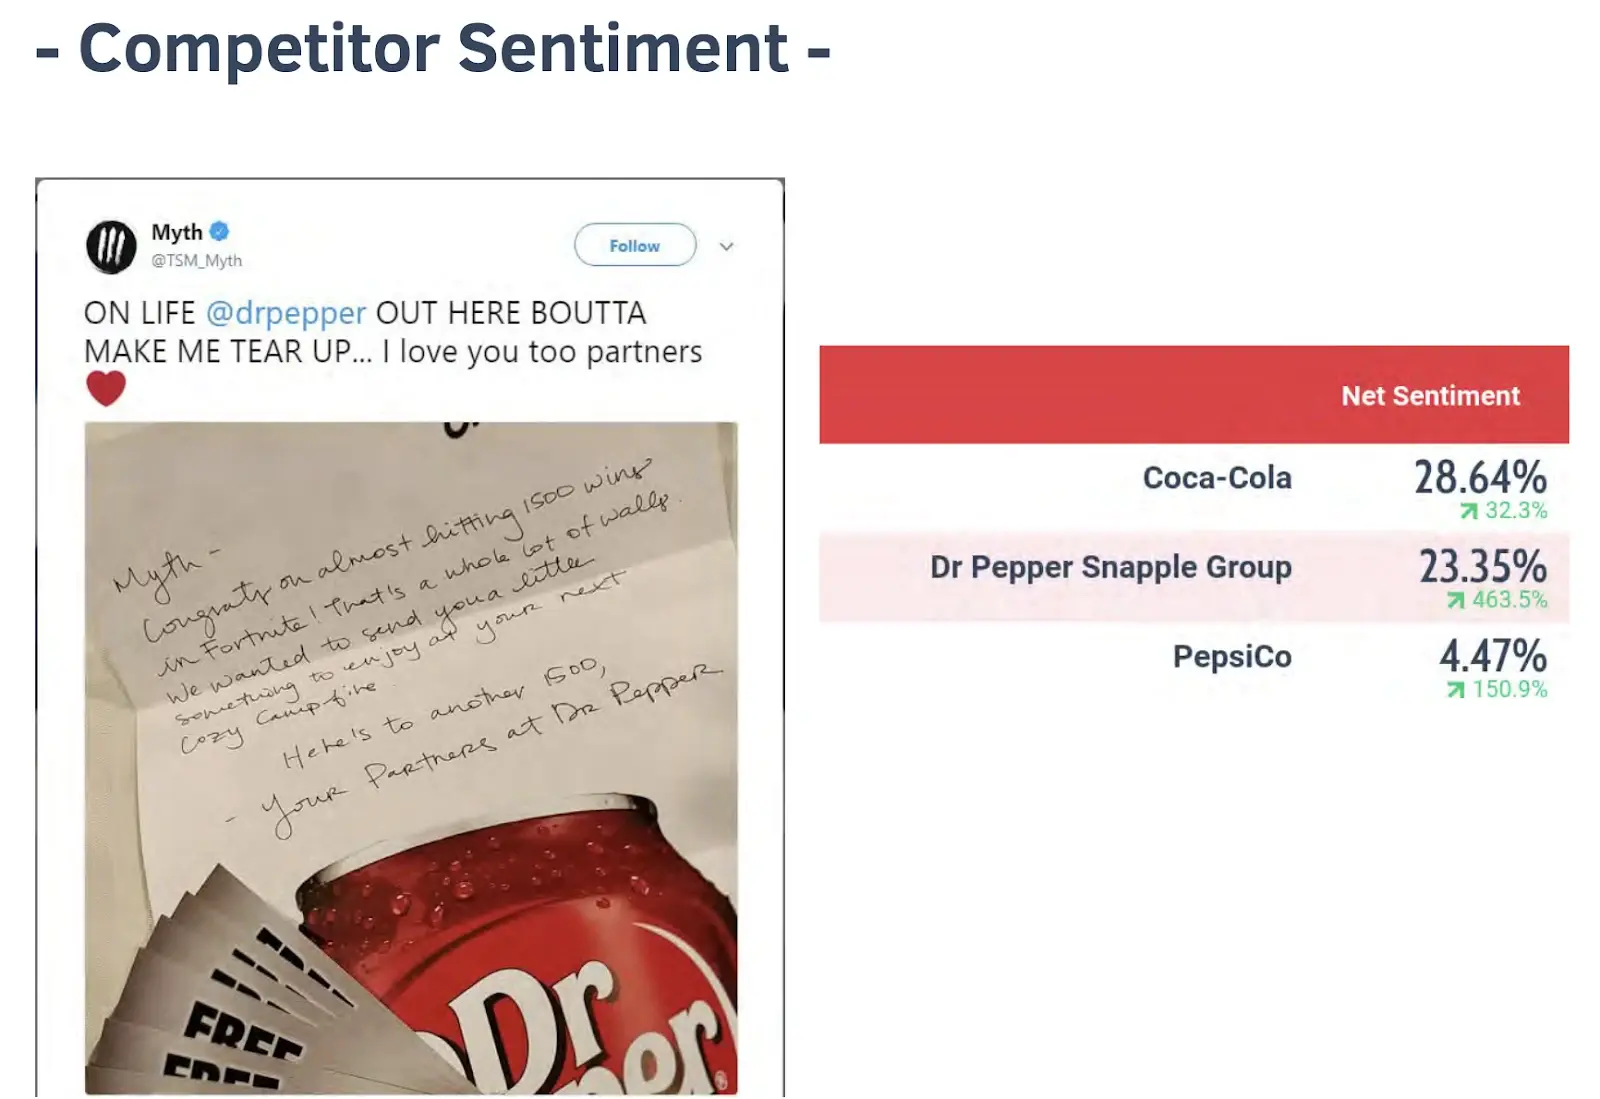
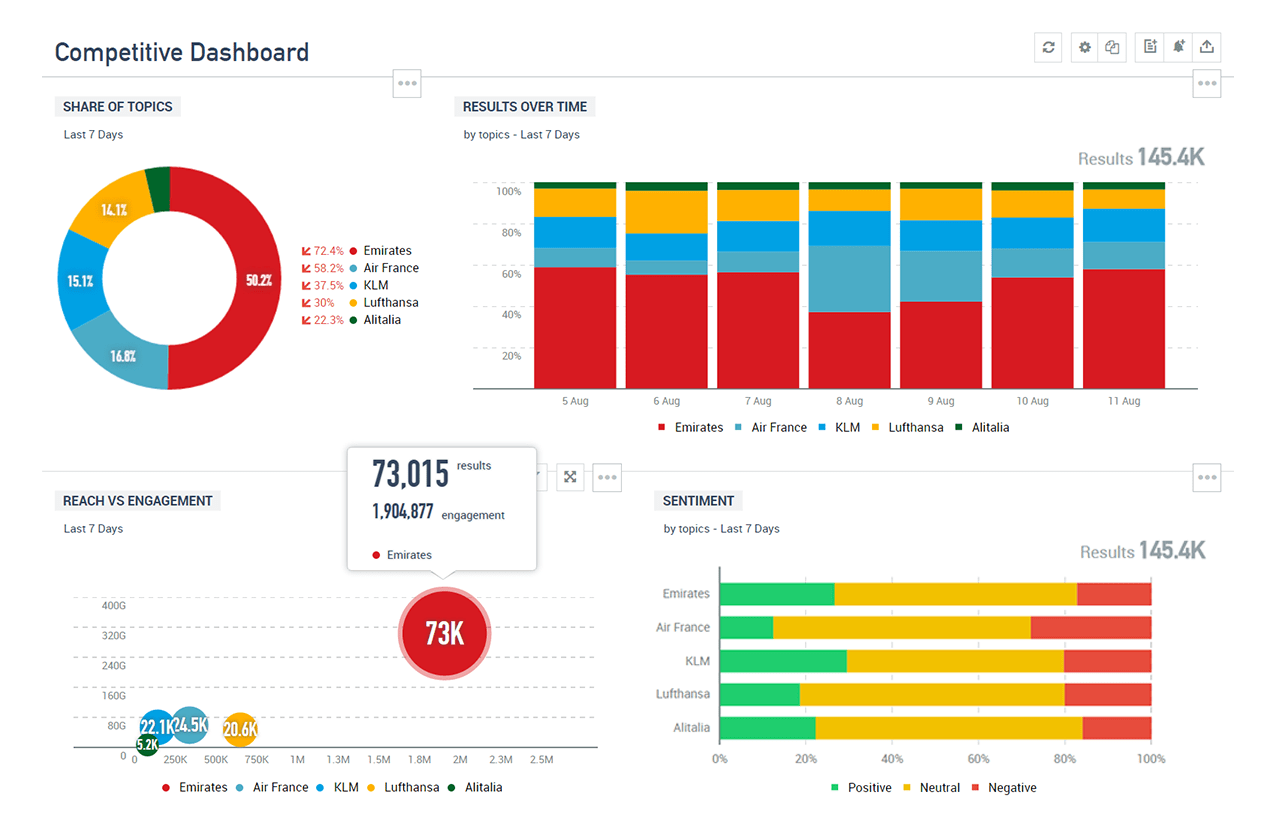
Competitor analysis
Next, compare your social performance against key competitors. This helps you benchmark your results and discover strategies that might work for your brand.
To conduct competitor analysis, monitor competitor account and use competitive intelligence tools that track their engagement, content strategy, and audience growth.
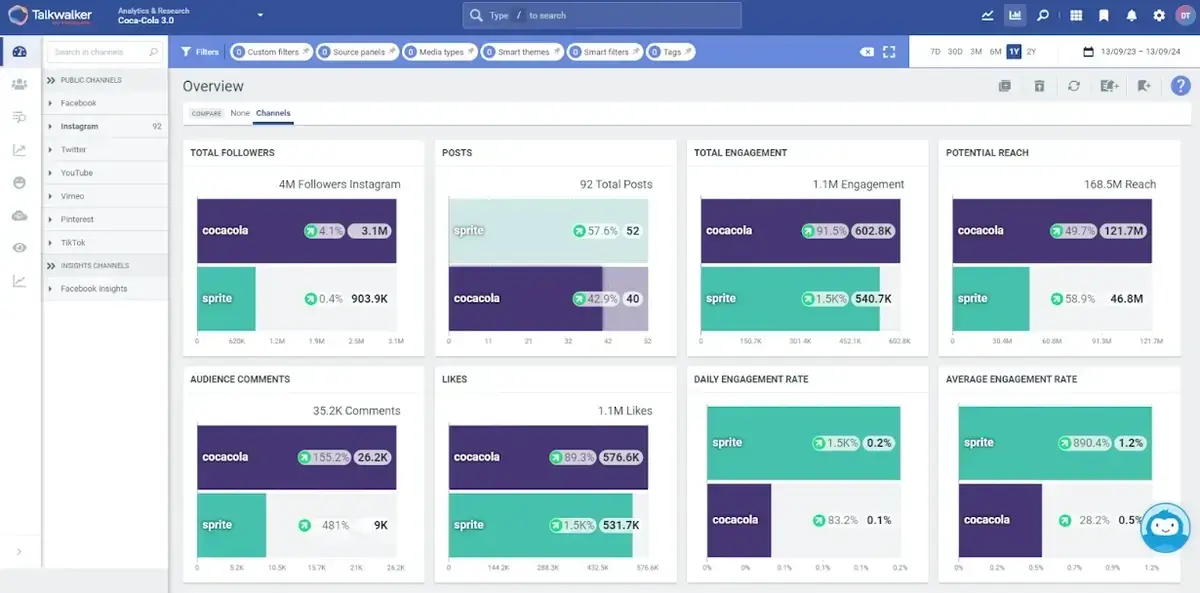
Key metrics:
Comparative growth rates and engagement
Content strategy differences
Share of voice in your industry
Publishing frequency and timing patterns
Brand performance and brand health
You can also monitor the overall health of your brand on social networks by tracking perception, conversation volume, and engagement trends.
This gives you a holistic view of your brand awareness in the market.
To assess brand health, combine metrics like mention volume, sentiment, share of voice, and engagement with qualitative analysis of brand conversations.
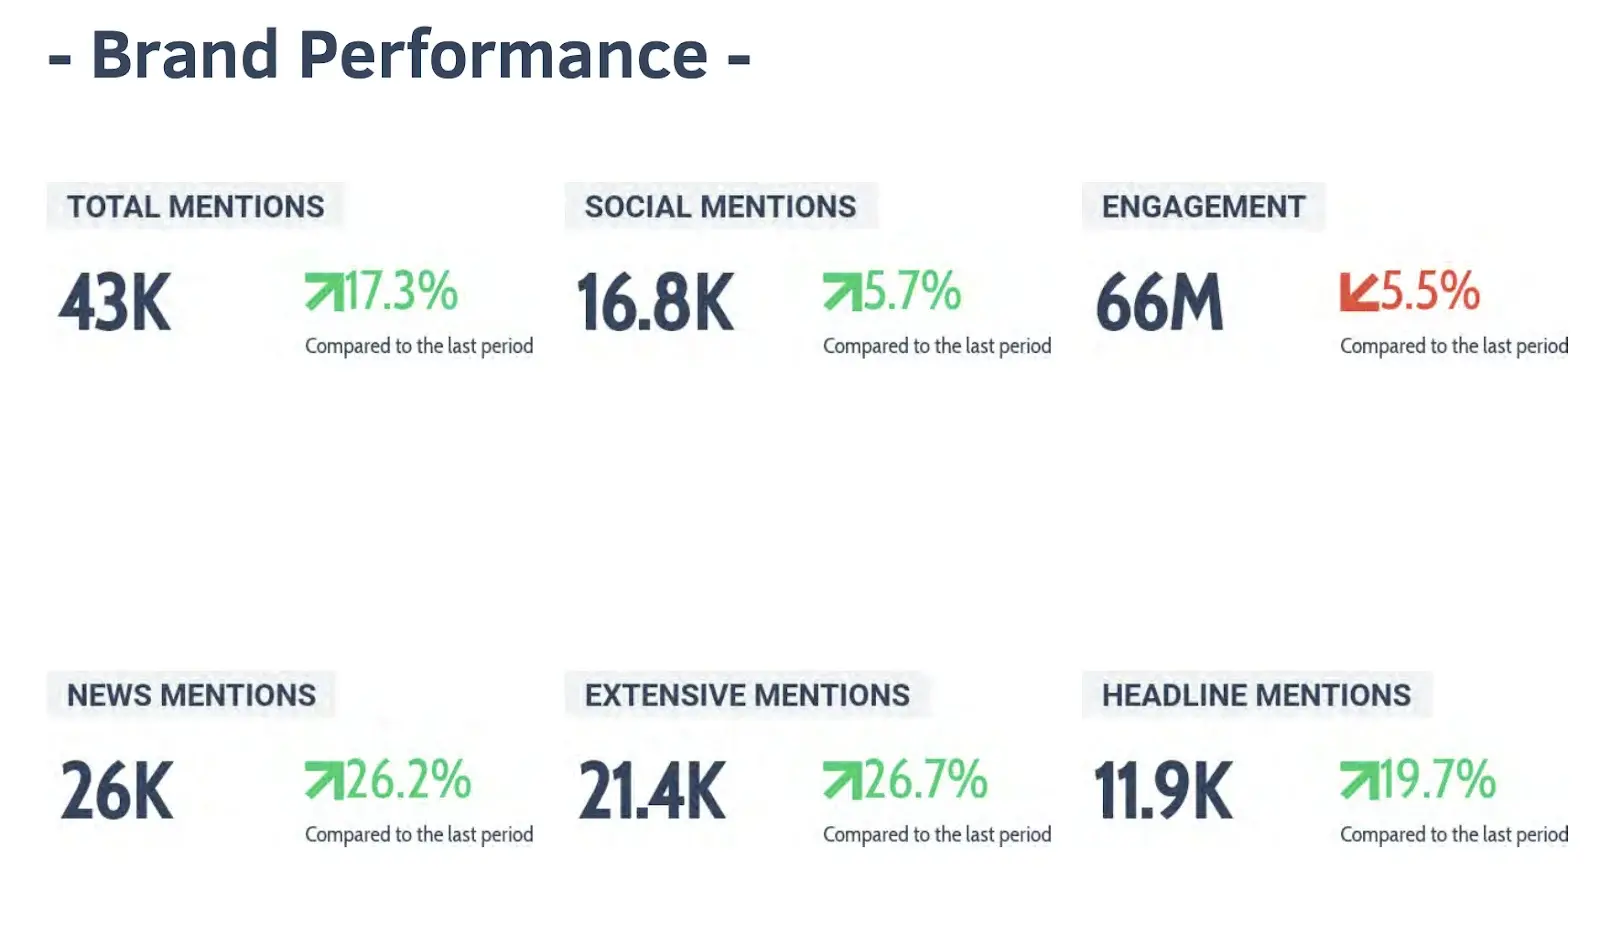
You could also dig deeper and compare your brand positioning with public and press perception. This identifies gaps between how you want to be seen and the reality.
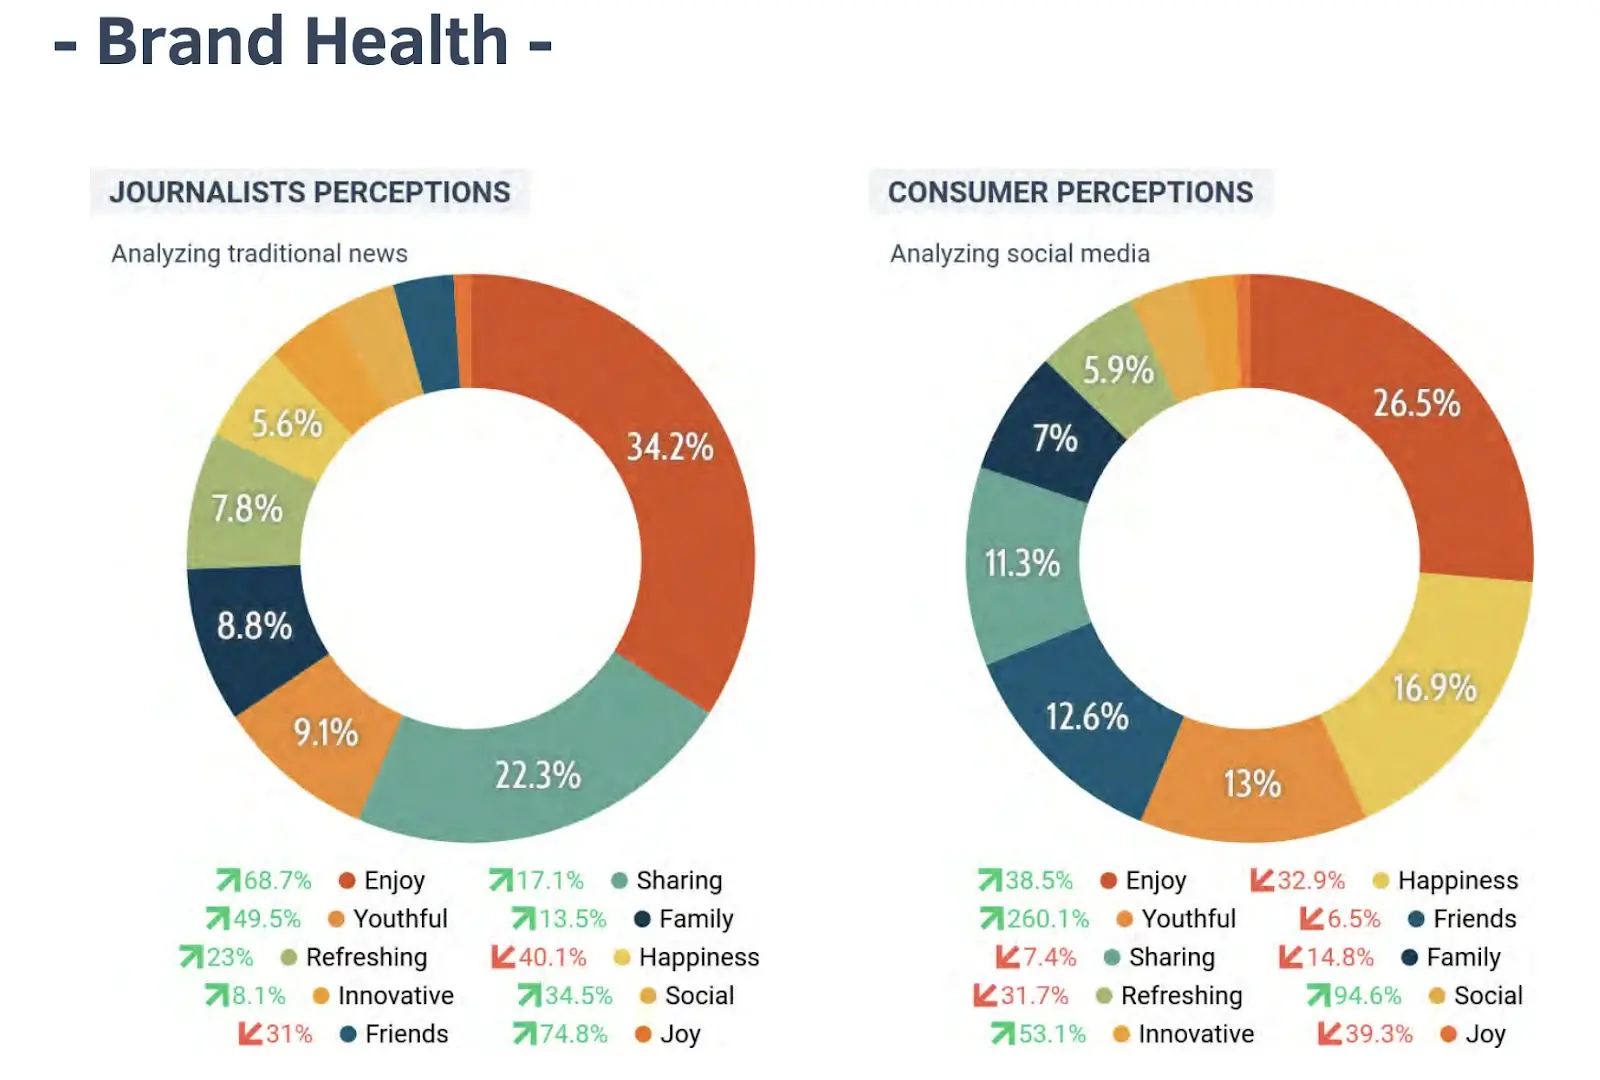
Key metrics:
Brand mention trends over time
Brand sentiment distribution and changes
Share of positive brand attributes
Brand association analysis
Executive visibility
Next, measure the social media presence and impact of your company's leadership team. This helps build thought leadership and humanize your brand through executive voices.
To track executive visibility, monitor mentions and engagement with content from or about your executives, and measure the impact on brand perception.
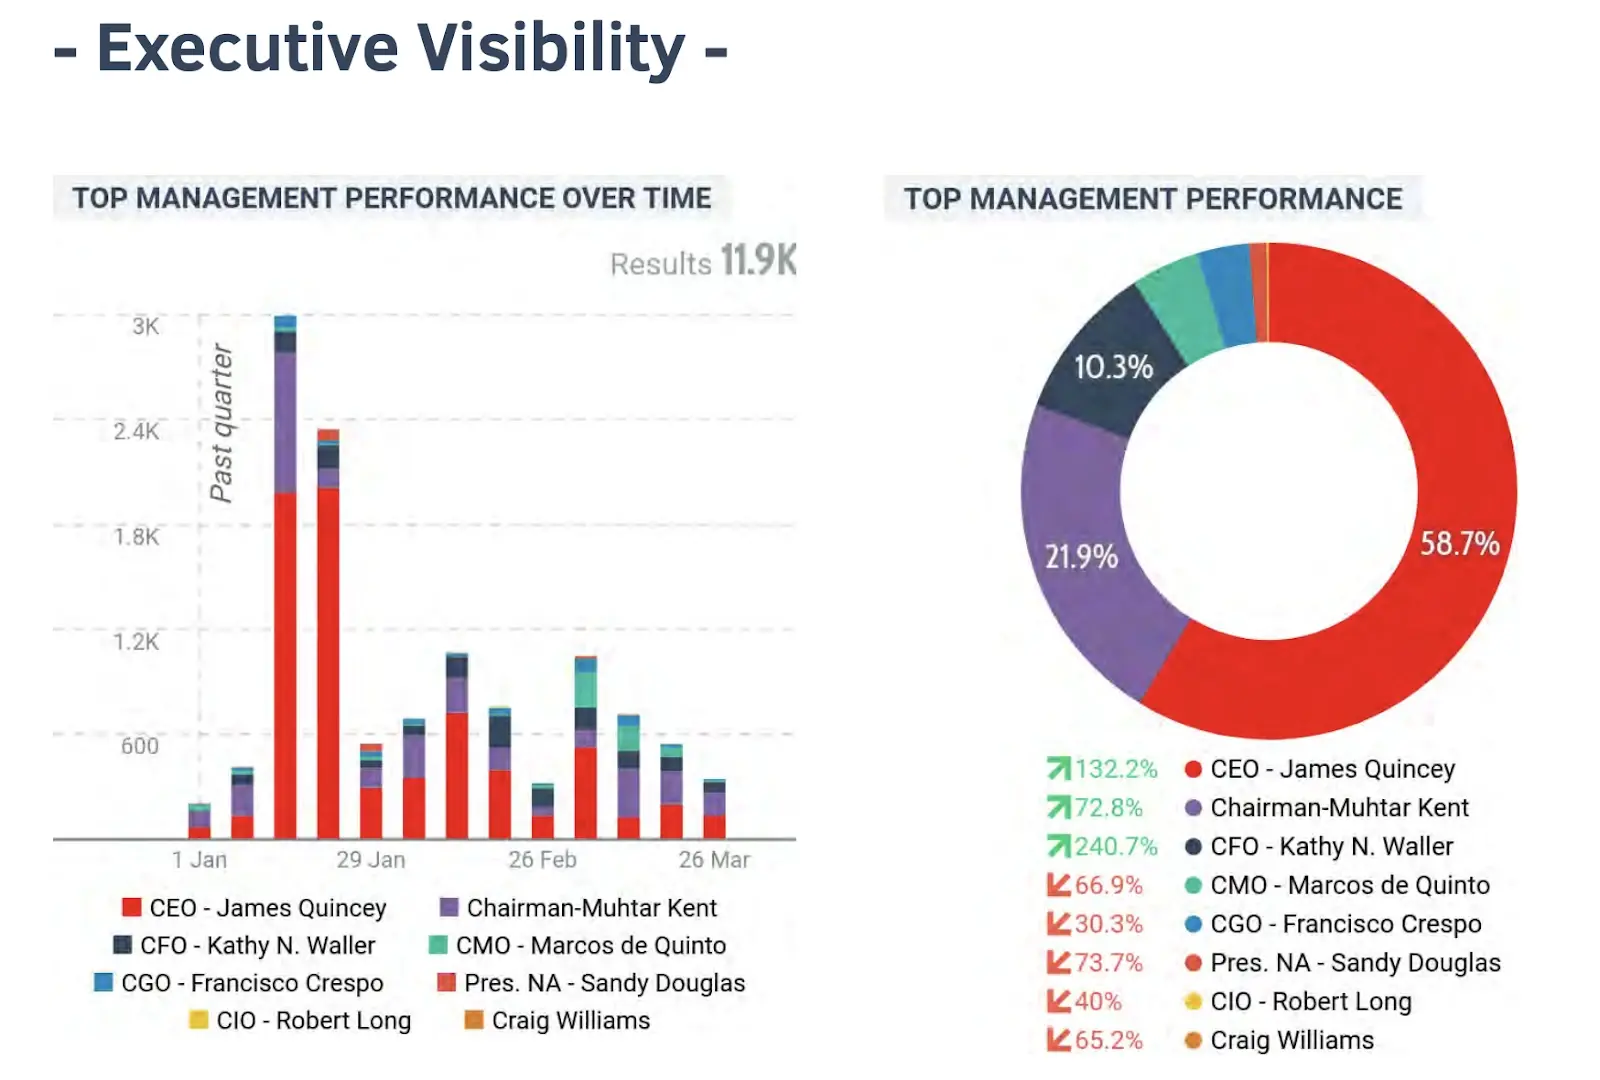
Key metrics:
Executive mention volume and sentiment
Engagement on executive content
Share of voice among industry leaders
Thought leadership topic performance
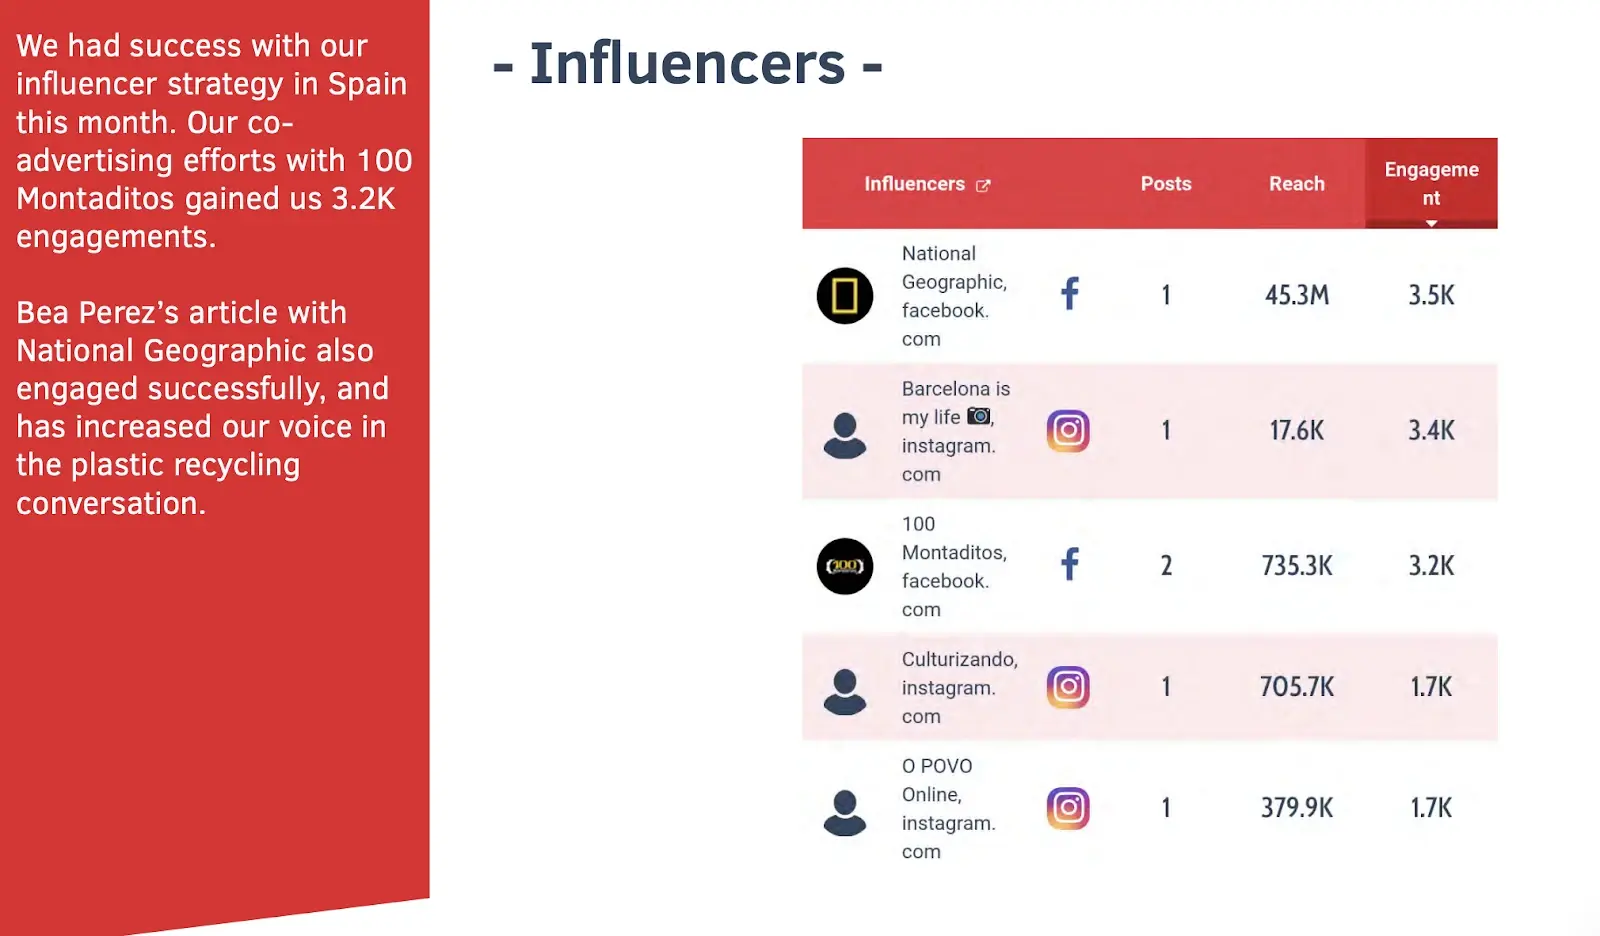
Influencer performance
Do you also invest in influencer marketing? Make sure to track its performance, too!
It’s key to understanding which partnerships deliver the best social media results and deserve continued investment.
To monitor influencer performance, track engagement on influencer content featuring your brand, and measure referral traffic and conversions from influencer partnerships.
Specialized tools like Talkwalker provide influencer performance data alongside other social media reports.
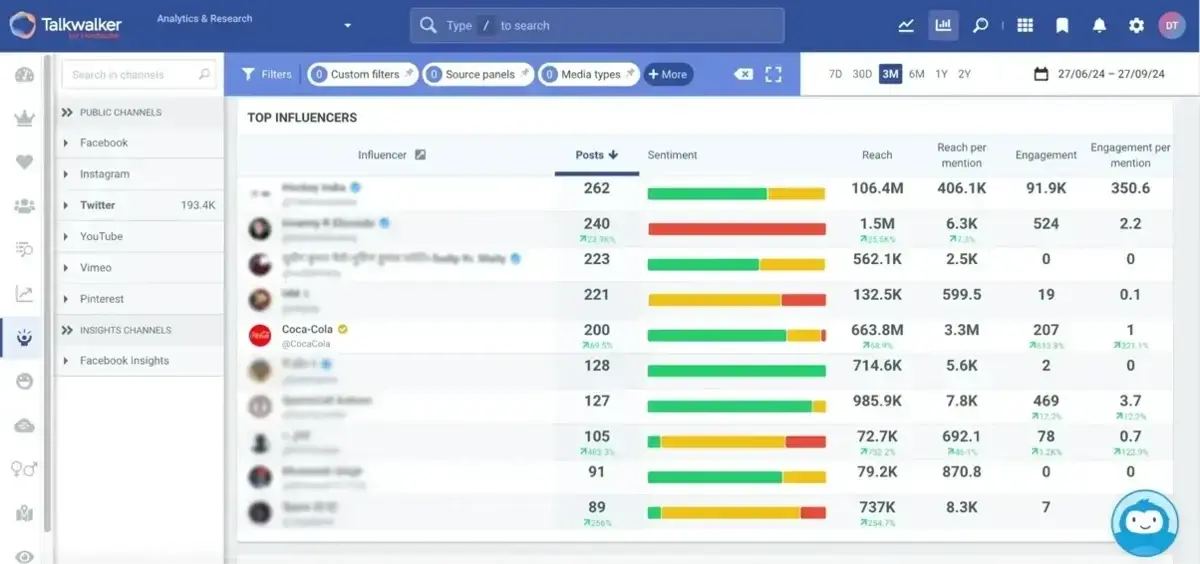
Key metrics:
Influencer content engagement rate
Audience reach from influencer collaborations
Conversion rate from influencer referrals
Industry trends
It’s also important to see the bigger picture and analyze your niche.
Track emerging topics, hashtags, and conversations in your industry to find opportunities for your social media marketing.
This helps you create relevant content, jump on trends quickly, come up with viral ideas, and understand your audience better.
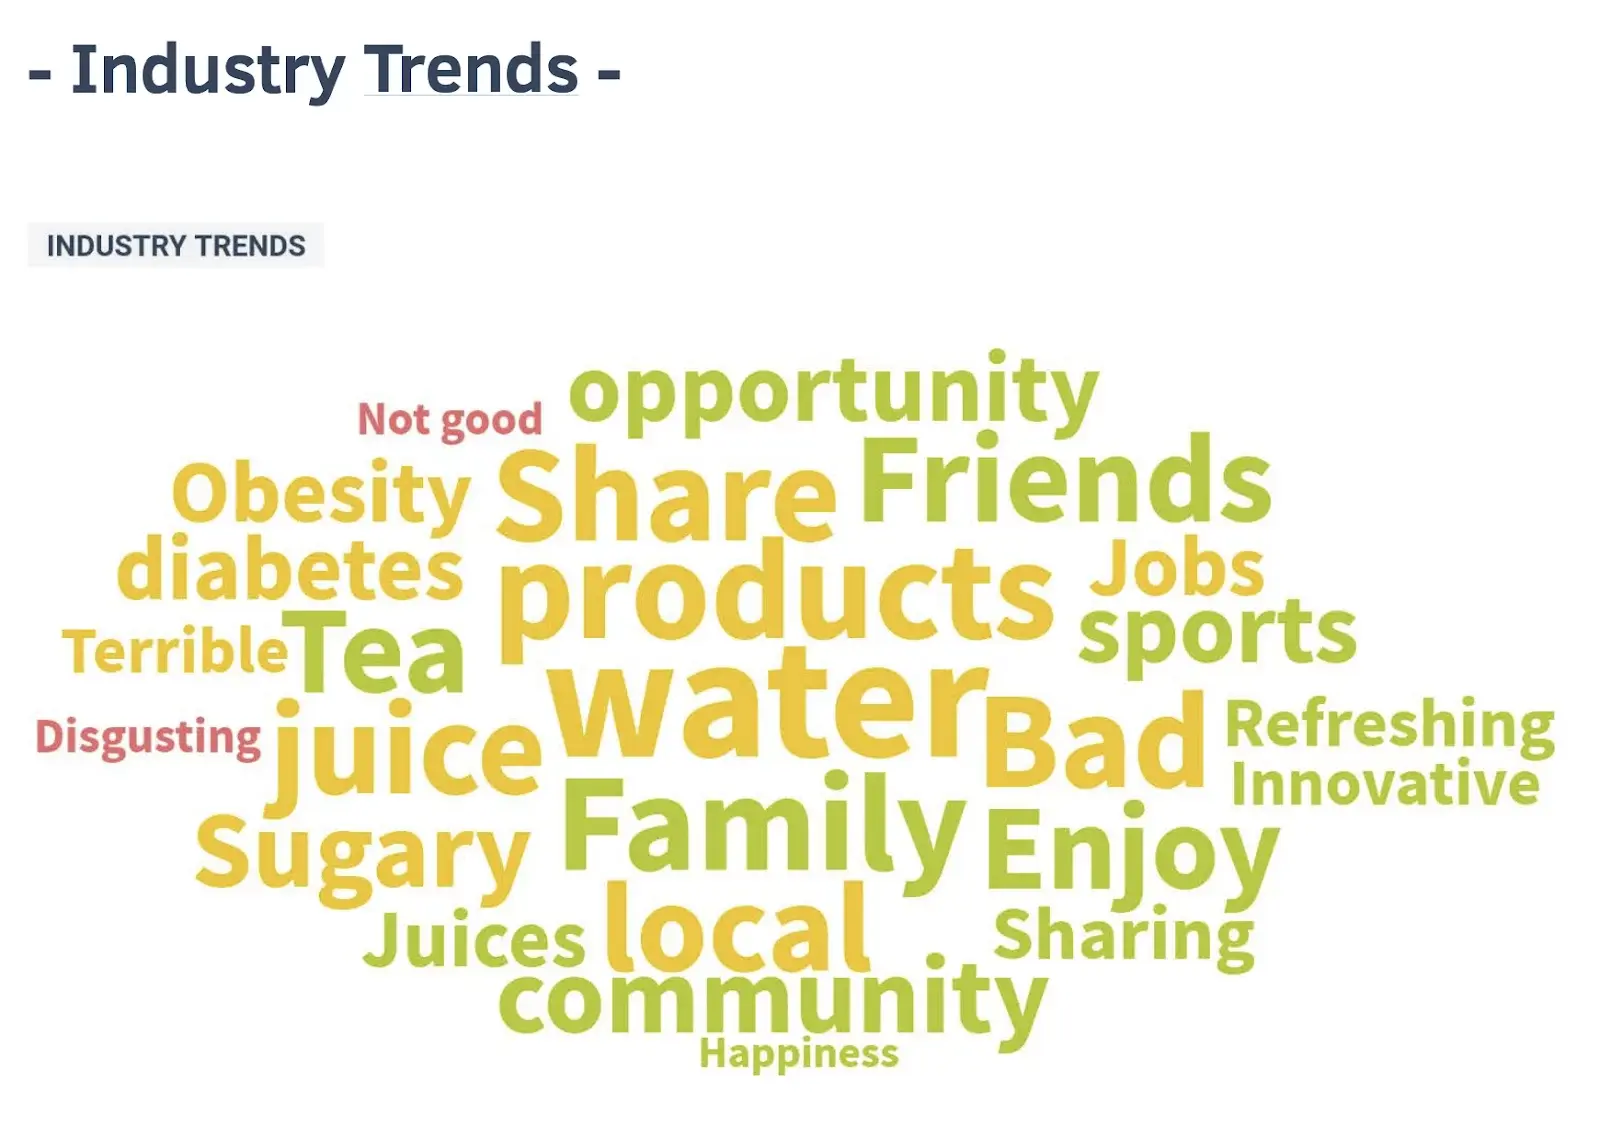
For this, implement media monitoring and track industry keywords, hashtags, and topics gaining traction in your market.
Key metrics:
Trending topics in your industry
Emerging hashtags and conversation themes
Seasonal trend patterns
Content formats gaining popularity
Action points
Conclude your social media report with clear, data-driven recommendations. These action items transform your report from information into strategic direction.
To come up with such action points, look for the biggest opportunities from your data, important trends, and gaps in your strategy.
For example, do you see that thought leadership content from your founders outperforms other formats, but the executive visibility remains low? Double down on your employee advocacy efforts!
Or, did you notice that your competitors leverage industry trends you have been ignoring? Update your social media content plan!
Key elements:
Strategic priorities based on data insights
Specific optimization opportunities
Resource allocation recommendations
Experiment proposals for the next period
How to create an effective social media report in 8 steps
Creating social media reports that drive decisions requires a methodical approach.
Here's how to build reports that showcase real value and impact.
1. Define the “audience” for your report
Before opening any analytics dashboard, identify who will be reading your report.
Are you preparing this for your CMO, who needs business impact metrics? Or for the social media team, who needs tactical insights?
Different audiences require different levels of detail.
For example, C-suite executives usually want high-level metrics connecting social media to business outcomes. And social teams typically need platform-specific metrics that guide day-to-day decisions.
Your audience determination directly impacts every other decision you'll make about your report—from metrics to visualization options and recommendations.
2. Establish the report’s focus and key goals
Determine what specific question or purpose this report addresses.
Is it a regular performance overview? A campaign analysis? A competitive benchmarking report?
Your report's focus shapes its structure and content.
For example, a monthly performance report provides a broad overview of all social activities, while a campaign report offers a deep dive into specific initiatives. Specify the following elements:
Key goal(s) of your report: e.g., analyzing the performance of a recent campaign
Time period you want to analyze: e.g., the dates the campaign was active
Specific metrics you want to track: e.g., reach, engagement, and conversions
3. Determine the scope of your report
Now that you know the goal and focus of the report, list the items and areas to cover. This way, you can keep things comprehensive without making the report overwhelming.
First, decide which platforms to include in your analysis. Your selection should reflect where you're investing resources and where your audience engages most actively.
Next, determine whether you're covering organic performance, paid campaigns, or both. These often have different metrics and goals, so be clear about which you're analyzing.
For regular performance reports, include both, but separate them into distinct sections with appropriate metrics for each.
Then, add a section comparing their performance and highlighting budget distribution.
Finally, consider related channels that might impact social performance.
Will you include email campaigns that drive social traffic? Are influencer collaborations part of your scope? What about user-generated content from brand communities?
Include these elements if they impact the goals you're measuring.
4. Create a template for your social media report
Once you have a clear idea of your report’s focus and scope, outline the key items you want to include and pick a template.
Remember, the visual presentation of your data is just as important as the metrics themselves.
Start with a clear structure that follows a logical flow—from high level overview to detailed platform-specific insights.
Use consistent headers, colors, and formatting throughout to create a professional appearance that aligns with your brand guidelines.
Next, incorporate visuals to make data more digestible. Charts, graphs, and screenshots are more effective than tables of numbers alone.
Use color-coding consistently—for example, green for positive trends and red for areas needing attention.

When displaying benchmarks and comparisons, use visual elements like arrows or sparklines to show trends at a glance.
This helps busy stakeholders quickly understand performance direction without needing to analyze numbers.
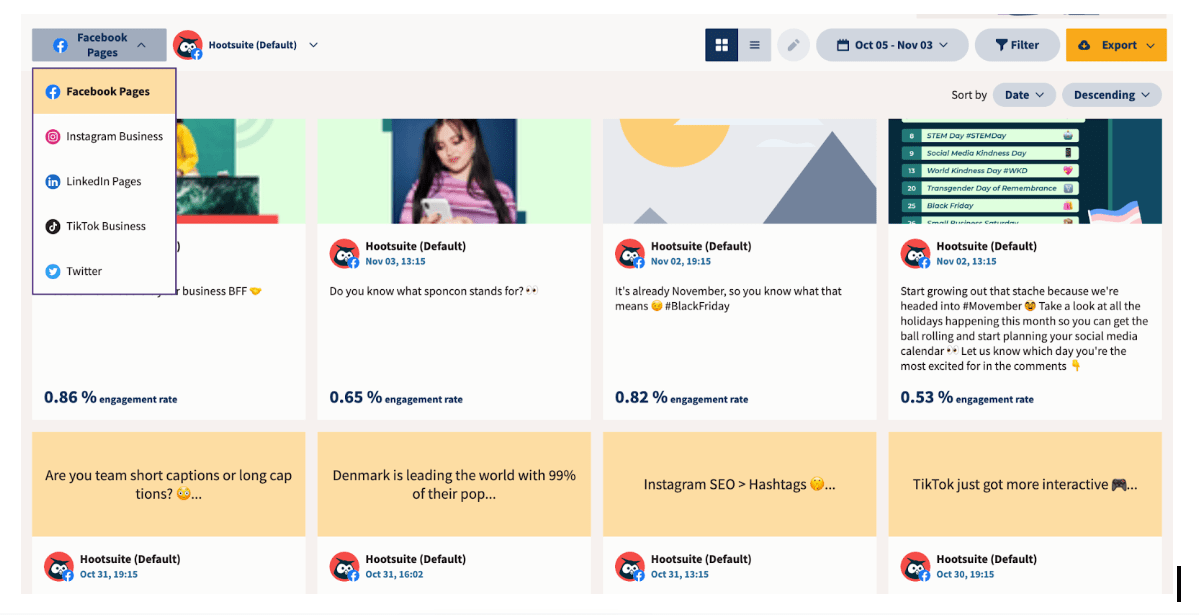
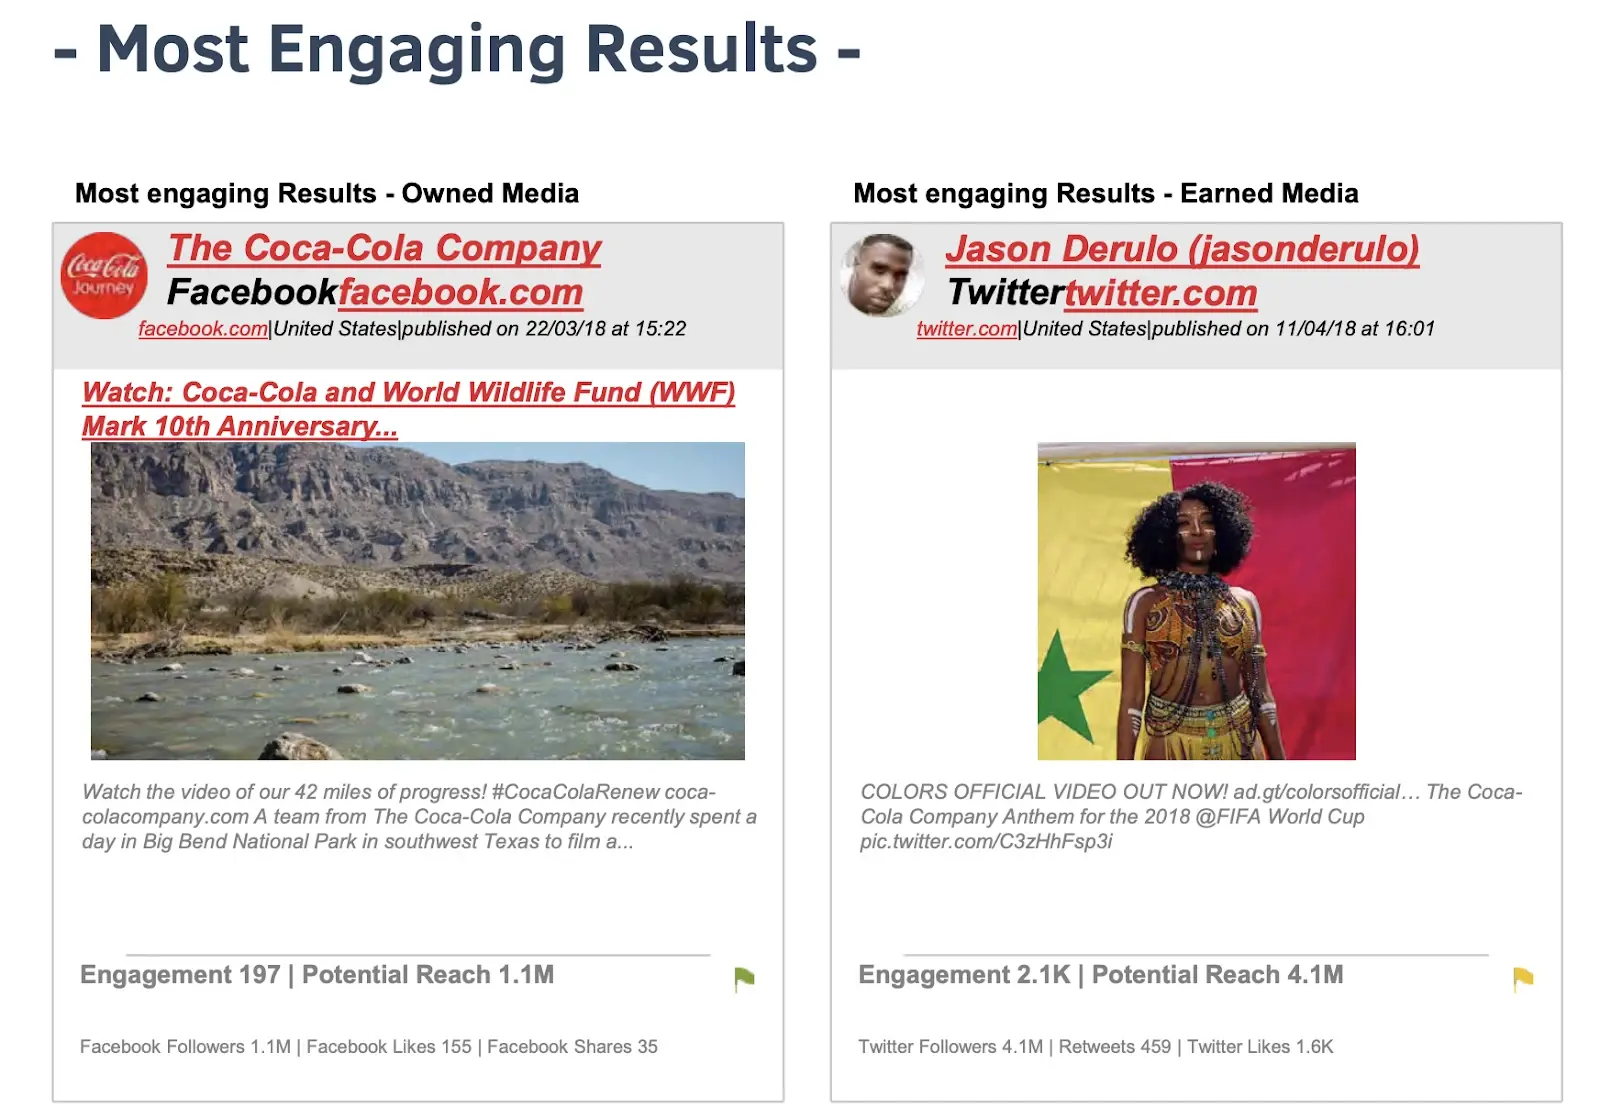
Finally, include actual examples of social media content alongside performance data to provide context.
Screenshots of high-performing posts help illustrate what's working and why, making your report more actionable and engaging.
Want a ready-to-use solution? Download Hootsuite’s social media report template and customize it to fit your needs.
5. Collect the data
At this point, you’re ready to start collecting the actual data.
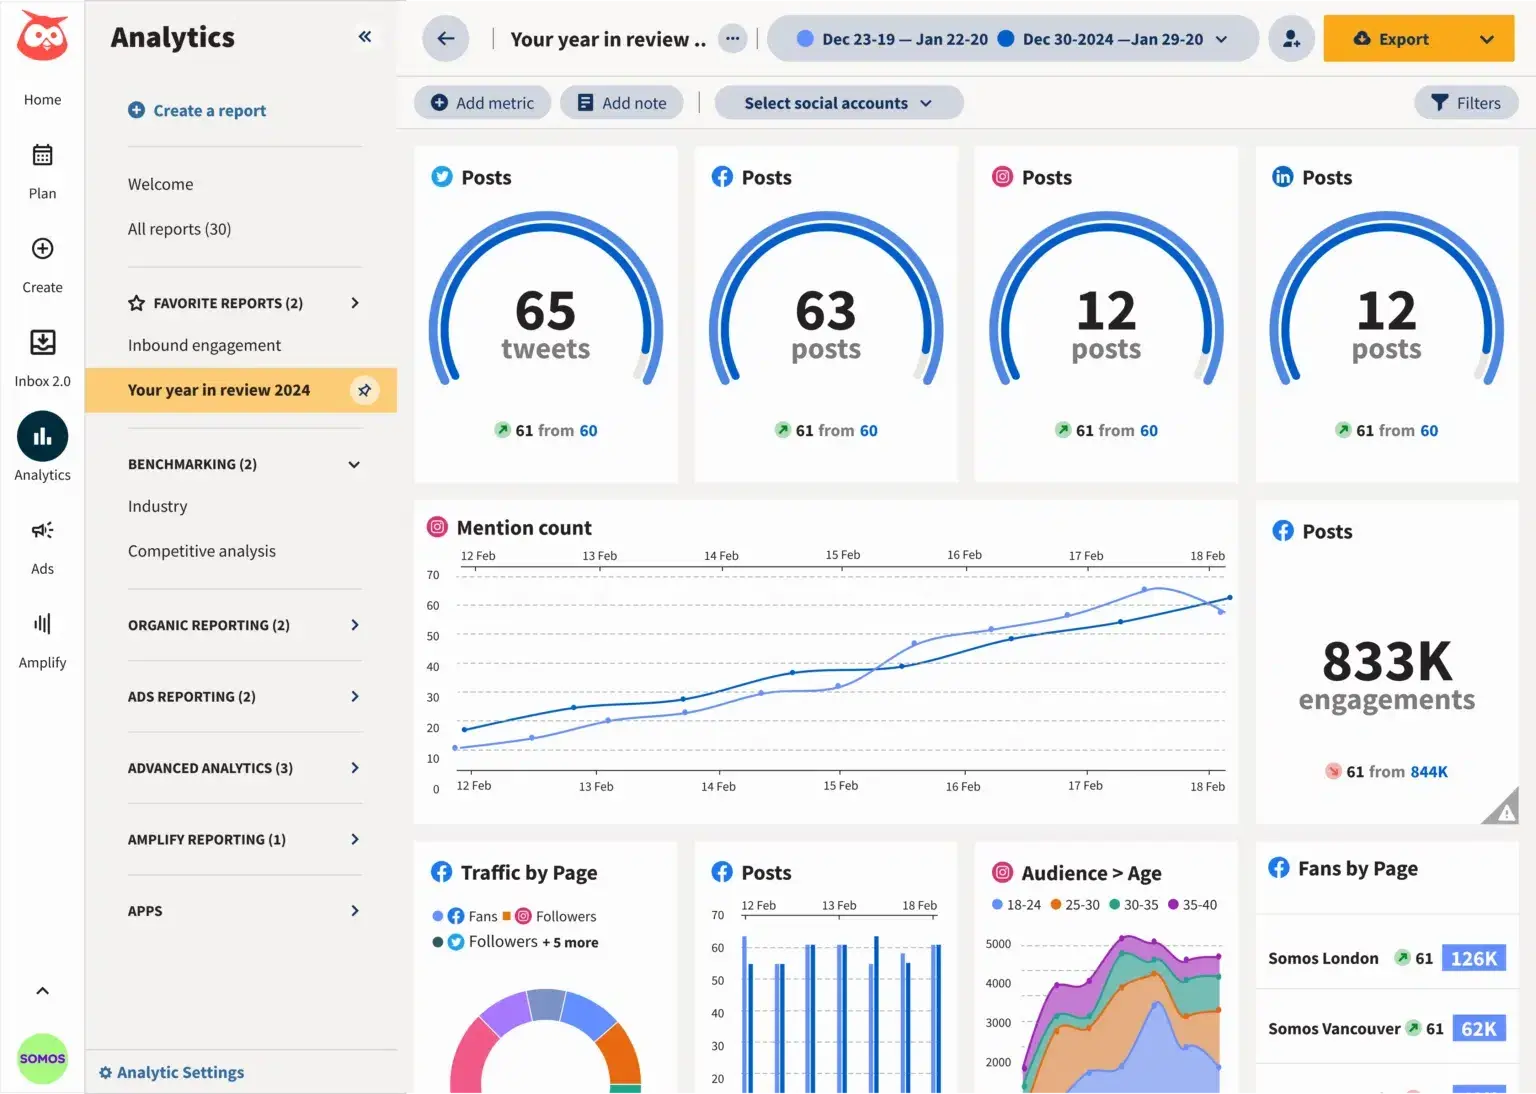
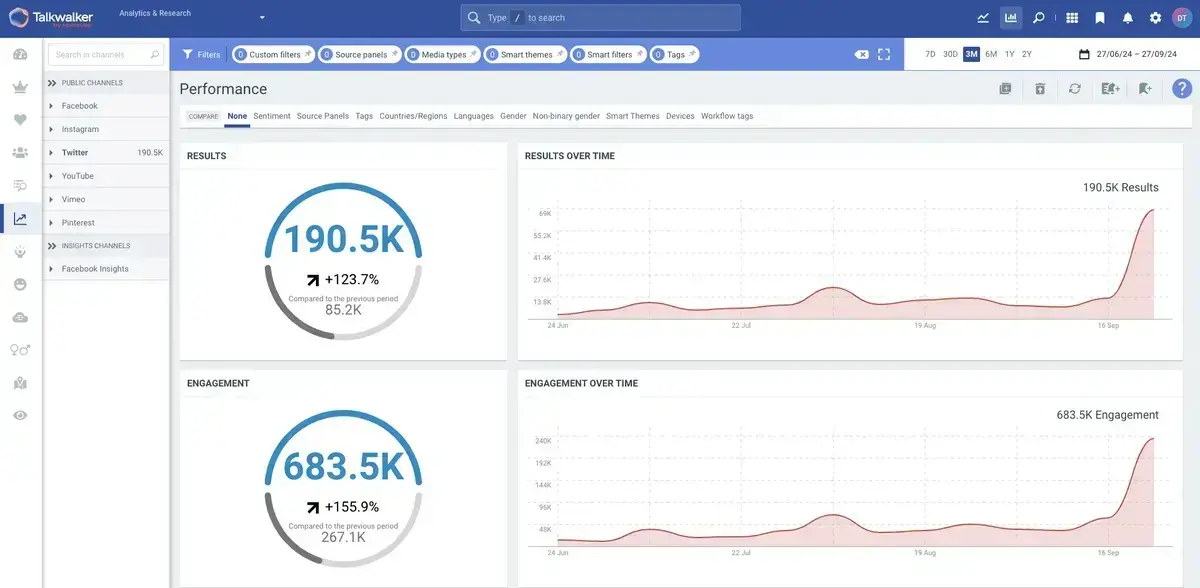
If you use a social media reporting tool like Talkwalker or Hootsuite, simply set up your date ranges in the analytics dashboard and export reports for each metric category.
It will automatically consolidate data from multiple channels, making it easy to analyze cross-platform performance and even track ROI through integrated conversion tracking.
Working without specialized tools requires a more manual approach.
Log into each platform's native social media analytics separately—from Meta Business Suite to X Analytics and LinkedIn Insights—and export data for your reporting period. bn
Then, create a master spreadsheet to bring everything together, using consistent formulas to calculate engagement rate and other important metrics.
For tracking conversions, combine click data from social platforms with website performance data from Google Analytics (GA4), using UTM parameters to maintain attribution accuracy.
Pay special attention to data consistency when pulling from multiple sources. Ensure your date ranges match exactly across platforms and that you're using the same definitions for social media metrics across channels.
For instance, an "engagement" might include different actions depending on the platform, so be clear about what each number represents.
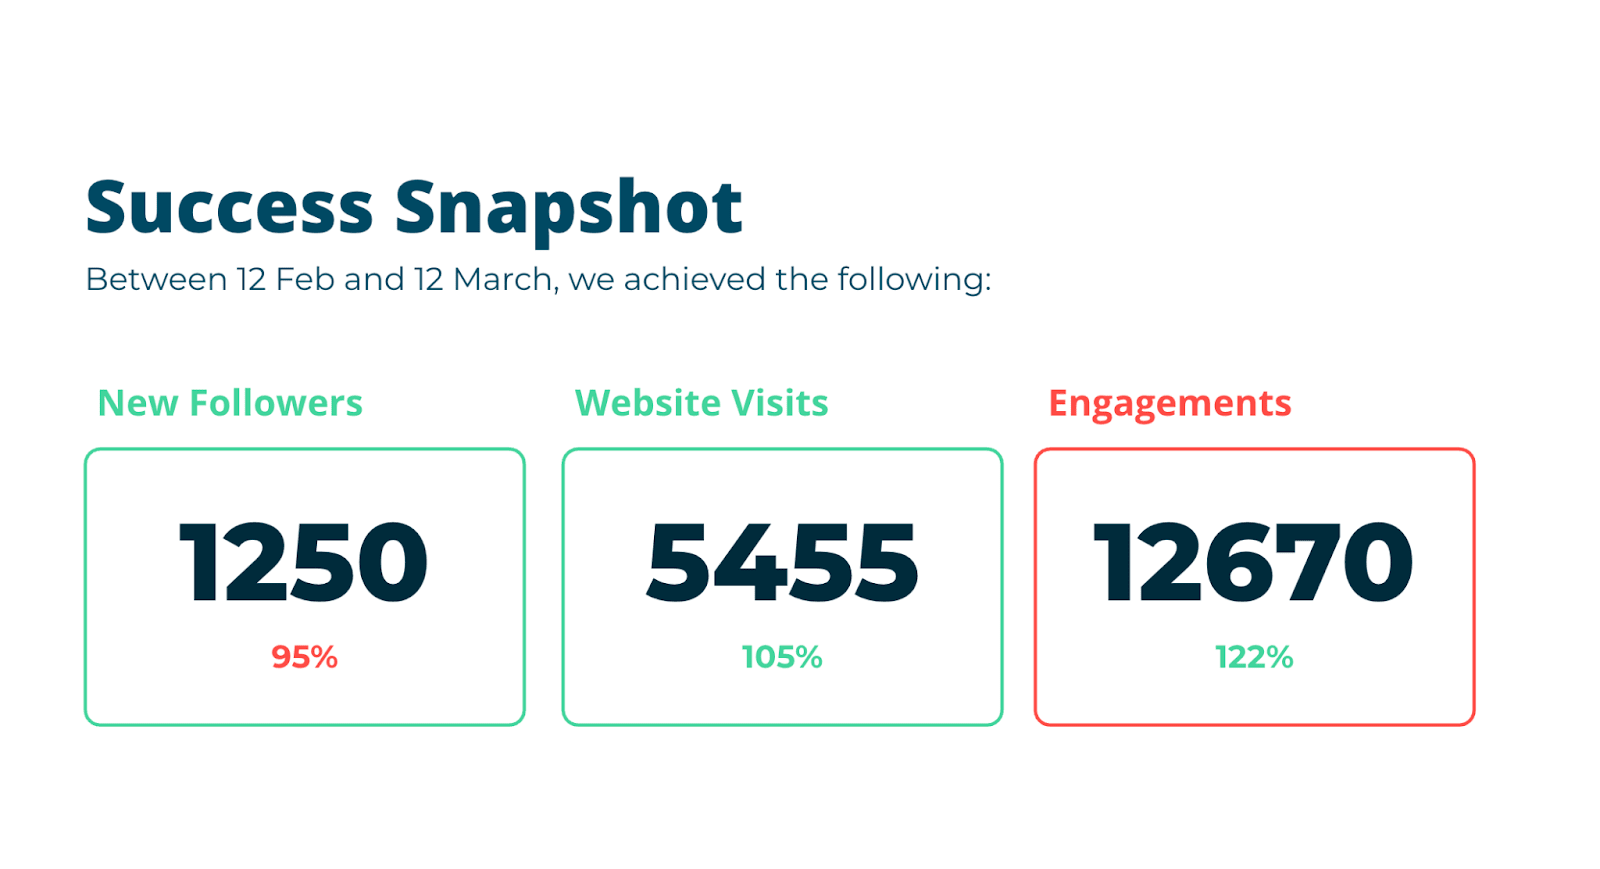
6. Compare with goals and past periods
Once you’ve collected the data, place your current social media performance in context by comparing it against:
Initial goals
Relevant historical data
Month-over-month comparisons reveal immediate trends, while year-over-year analysis accounts for seasonal variations that affect engagement patterns.
It’s also a good idea to create visual trend charts that instantly communicate performance direction.
Graphs showing key metrics over time make patterns and anomalies immediately visible to stakeholders who may not want to analyze detailed numbers.
7. List insights, recommendations, and actions
To make your report even easier to digest, annotate significant changes with explanations—whether that's a platform algorithm update, a strategic shift in your approach, or external events affecting your industry.
When presenting metrics, always explain what they mean for your business goals.
Don’t just mention that you had an increase in negative mentions or an increase in positive ones. Instead, provide a detailed explanation of what happened and why.
8. Document the process
Congratulations! You have created your social media report and presented it.
What’s next?
Turn it into a repeatable reporting process to ensure consistency and efficiency as your reporting needs evolve.
Start by documenting the entire workflow you’ve just implemented, and create dedicated SOPs—from data collection to presentation format. For example: “How to create monthly social media performance reports.”
This documentation becomes your playbook for future reports and helps new team members onboard faster.
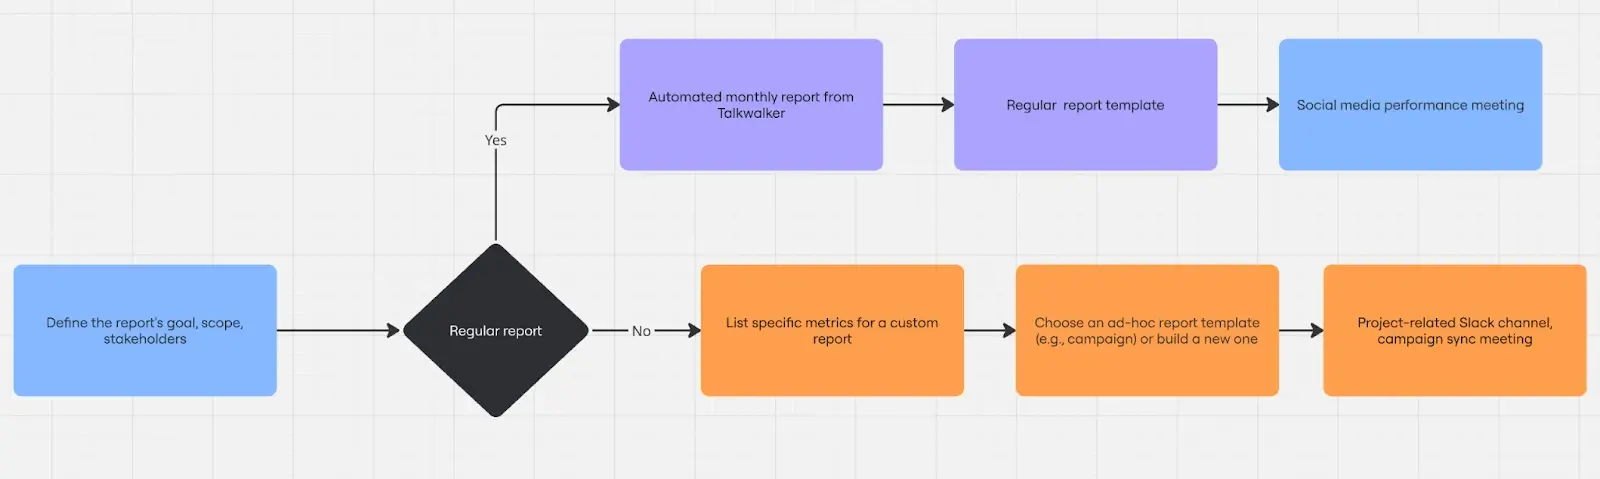
Next, develop a clear file-storing process and naming convention for both raw data exports and finished reports.
This can be as simple as creating dedicated Google Drive folders, using a structured naming system like "Brand_ReportType_Date," and setting up a process for sharing the reports in relevant channels.
Finally, establish clear roles in the reporting process:
Who collects data from each platform
Who analyzes the information
Who presents findings to stakeholders
To make sure the process remains effective, schedule periodic reviews of how social media reports are created, what data is featured, and so on.
Types of social media reports
As you can see, different reporting needs call for different report types.
To sum it all up, we’ve put together a breakdown of the most common social media reports and when to use them:
Monthly performance reports: Provide regular updates to internal stakeholders on key metrics and KPIs. These reports track ongoing progress and help identify important trends.
Campaign reports: Evaluate specific social media campaigns after completion. These reports summarize reach, conversions, ROI, and other campaign-specific metrics. Use these to demonstrate campaign effectiveness and gather insights for future initiatives.
Sentiment and brand health reports: Monitor how your brand is perceived across social networks using AI-powered sentiment tracking. These reports identify potential reputation issues and measure the effectiveness of your brand awareness efforts.
Competitive benchmarking reports: Compare your performance against competitors using benchmarks for engagement, share of voice, and content themes.
Product/feature mentions reports: Track conversations around specific products or features to analyze reception and feedback. These reports help product teams understand public perception and identify potential issues or opportunities.
ROI-focused reports: Connect social activities directly to business results by summarizing spend versus revenue impact.
Other “niche” report types could cover influencer campaigns, industry trends, crisis management, and other use cases.
The best social media reporting tools to use in 2025
Finding the right tool transforms your reporting process, helping you find the right data and extract actionable insights 10x faster.
Here are the top platforms that cover the entire cycle of social media reporting:
Talkwalker
Talkwalker's social media reporting tools combine social media analytics with automated report creation.
The platform tracks your social media performance, measures sentiment, analyzes your competitors, and demonstrates ROI.
It also collects data from from social networks, news sites, blogs, and forums, etc., then transforms it into customizable reports that can be shared throughout the organization.
Talkwalker’s AI-powered analytics engine processes both text and visual content, providing deeper insights compared to surface-level engagement metrics.
Key features:
AI-powered sentiment analysis with emotion detection for brand mentions
Customizable reporting with PowerPoint, Word, PDF, and Excel export options
Automated report scheduling and delivery directly to stakeholders' email
Visual enhancement tools to add videos, images, and comments within reports
Competitive benchmarking and share of voice measurement
Social listening cross multiple platforms and media types
Integration with CRM systems and business intelligence tools
Combined social data with lead generation statistics to demonstrate ROI
Price: Request a custom quote
Hootsuite
Hootsuite offers social media analytics tools that consolidate data from multiple platforms into one dashboard.
It tracks performance metrics on Instagram, Facebook, Twitter (X), TikTok, LinkedIn, YouTube, Pinterest, and Threads.

Beyond basic performance tracking, Hootsuite provides insights on engagement patterns, audience behavior, and content effectiveness.
Users can drill down to post-level analytics or zoom out for a broader view of their social media performance.
Key features:
Unified analytics dashboard for all major social platforms
Custom report creation with visual templates and export options
Competitive benchmarking to monitor up to 20 competitors
Best time to post recommendations based on audience activity
Performance score to track weekly improvements
AI-powered recommendations to boost engagement
Industry benchmarking to compare with similar businesses
Price: Paid plans start at $149/month.
Google Analytics (GA4)
Google Analytics 4 offers essential tracking capabilities for measuring social media performance and proving ROI.
While not a social media tool per se, GA4 provides insights that connect social efforts to website performance and business results.
The platform helps you understand how your content drives traffic, engages visitors, and generates conversions.
Key features:
Social media traffic attribution
Conversion tracking tied to specific social campaigns and posts
User behavior analysis showing how social visitors engage with your site
UTM parameter tracking for campaign performance measurement
Audience demographics and insights for social visitors
Custom event tracking for specific social media goals
Integration with social media management platforms like Hootsuite and Talkwalker
Price: Free for standard analytics; Google Analytics 360 is available for enterprise needs with custom pricing.
Start building effective social media reports
Social media reporting connects your social activities to business objectives and the bottom line.
When done right, it helps everyone in the company—including key stakeholders—understand the value of your social media efforts.
Key takeaways from this guide:
Tailor your reports to specific audiences to provide the right level of detail for each stakeholder
Include visual elements to make complex data more digestible and impactful
Compare current performance to historical data to provide essential context
Connect social metrics to business outcomes and specific goals
Document your reporting process and create SOPs
Use specialized tools to access various types of social media data with ease
Ready to transform your social media reporting?
Request a free demo of Talkwalker's reporting tools and see how they can help you aggregate the data you need—faster and more efficiently.