
Social Media Analytics: A Practical Guide (+ The Top 7 Tools)
Optimize your social media strategy with analytics. Learn to track key metrics, improve content, and choose the best tools for actionable insights.
October 8, 2024
Social media is only effective when it delivers on your target metrics.
Likes, shares, comments—all this sounds great, but how does it impact the bottom line?
Implementing comprehensive social media analytics is the only way to find out.
In this guide, we'll share our learnings from 15 years in the social media industry.
You'll find out how to set up social media analytics, choose the best tools, and track the right metrics.
What is social media analytics?
Social media analytics turns your social media data (like followers, clicks, and shares) into actionable business insights. It answers questions like:
Who's following your brand on social media?
What do they think about you?
How well is your content performing?
Are you reaching the right audience?
Does your social media content contribute to conversions?
At the end of the day, it helps you make sense of various metrics like social media engagement, reach and impressions, sentiment, and conversions.
Why do you need social media analytics?
Ever wondered if your social media efforts move the needle at all? We've all been there.
Measuring social media performance is not easy or straightforward.
The smart use of social media analytics tackles exactly that.
It helps you figure out what works well and what doesn't and finds ideas for improvements.
Here's what you can achieve:
Prove ROI: Show the real value of your social media campaigns to stakeholders.
Improve your content strategy: Discover what resonates with your audience and create more high-converting assets.
Spot trends early: Detect emerging topics and sentiments in a timely manner.
Manage brand reputation: Monitor and respond to customer feedback in real time.
Outpace competitors: Benchmark your performance and find gaps in the market.
Improve customer service: Spot and resolve issues quickly to boost customer satisfaction.
Understand your audience better: Gain insights into who your followers are, their preferences, behaviors, and pain points.
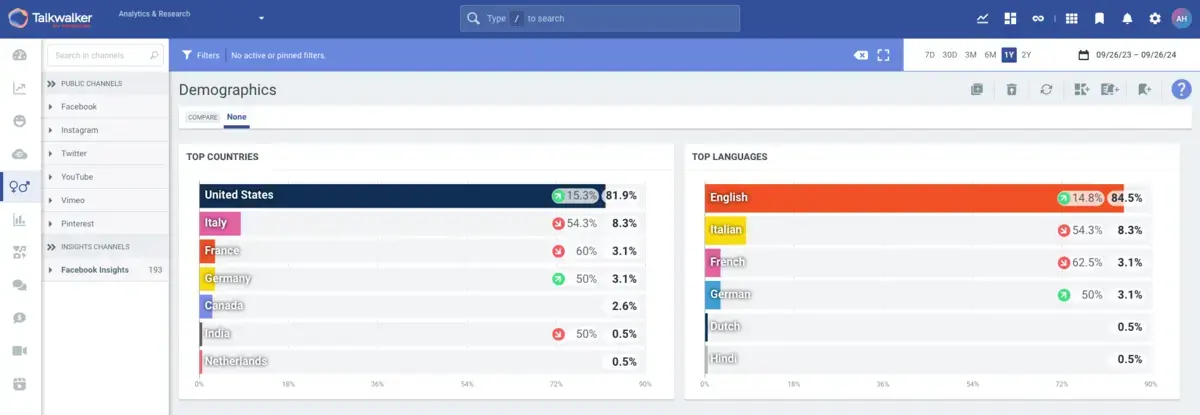
For instance, Talkwalker provides deep insights into your social media audience—and those of your competitors.
This data helps you understand their demographics, interests, preferences, and more.
Social media analytics also serves various use cases, from product development to crisis management.
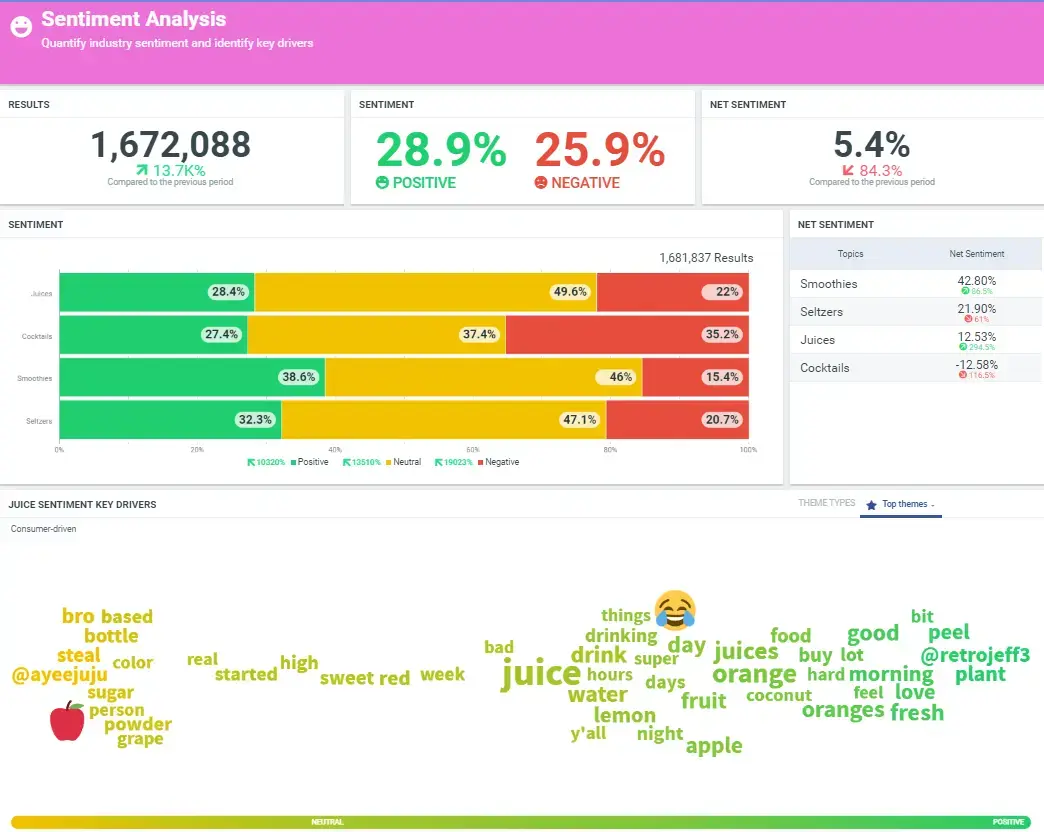
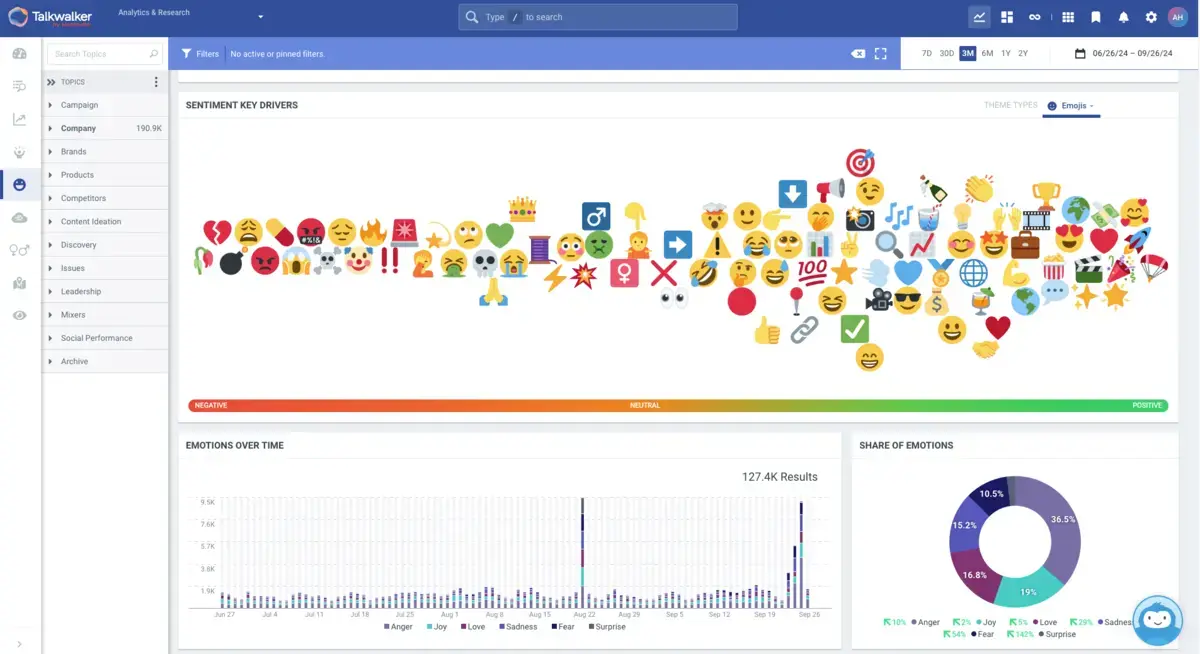
For example, you can use social media sentiment analysis to detect and address potential PR issues. It might also be useful for generating customer feedback to inform new features or products.
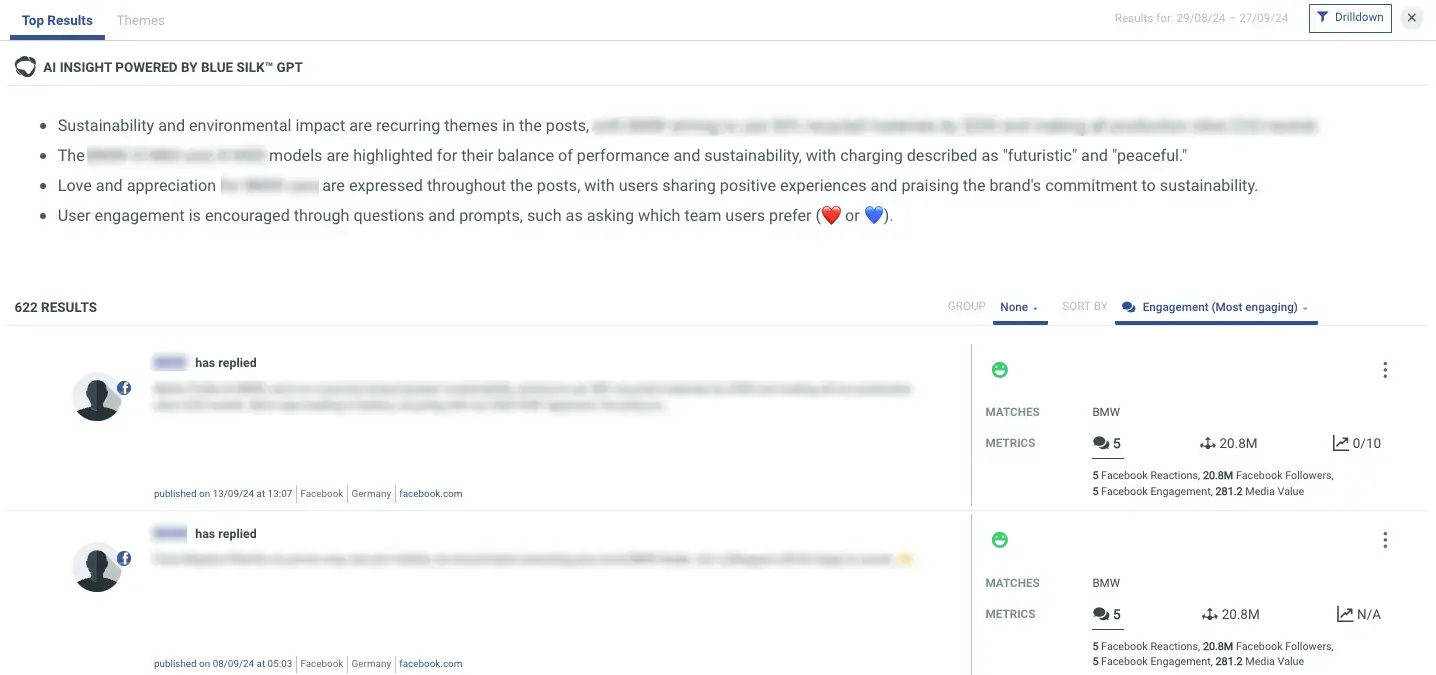
Here’s what social media sentiment analysis looks like in Talkwalker:
Other use cases include campaign optimization, sales forecasting, influencer identification, content performance optimization, and more.
The key types of social media analytics
There are many important aspects you can analyze in social media.
For example, you can use it to better understand your buyer personas.
Or, you can spy on your competitors and track what people say about your brand.
Let's explore these in detail.
1. Performance analytics
Performance analytics answers the most burning (and sometimes painful) question: Are these posts and likes actually doing anything?
It helps you figure out if your social media content resonates with your audience and generates meaningful actions.
What to look at:
Engagement rates (likes, comments, shares, mentions)
Reach and impressions
Click-through rates
Conversions (sign-ups, purchases, etc.)
Video views and watch time
Virality (how your content spreads on social platforms)
How to do it right:
Make sure to choose effective analytics tools to access useful data insights.
One option is to combine native social analytics (Facebook, LinkedIn, etc.) with platforms like Google Analytics (GA4) and HubSpot.
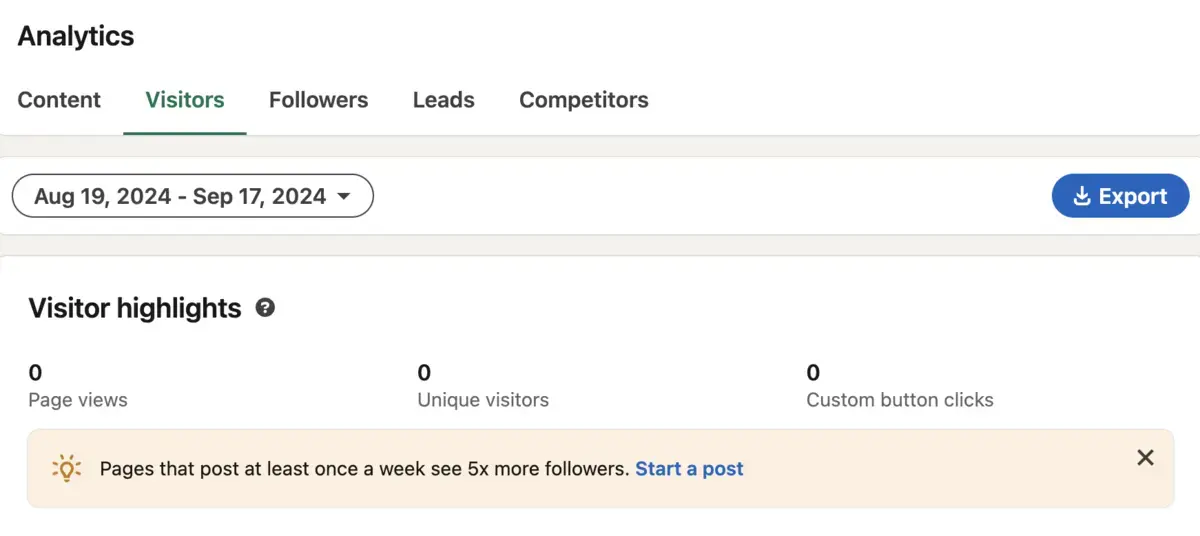
For example, LinkedIn lets you track followers, content performance, and leads:
You can also save time and use one-stop analytics platforms like __CONTENTFUL_MEDIA_3__, and capitalize on positive momentum.
What to look at:
Overall sentiment (positive, negative, neutral)
Sentiment trends over time
Emotion detection (joy, anger, surprise, etc.)
Topic-specific sentiment
Sentiment by channel or audience segment
Sentiment impact on engagement and conversions
How to do it right:
You can do basic sentiment analysis by manually searching for brand mentions and checking social media comments. But it won't take you far.
It's best to use tools that leverage AI and machine learning algorithms to analyze sentiment for you.
For example, Talkwalker provides AI-powered sentiment analysis that can detect nuances in language, including sarcasm and context-specific emotions.
Remember, sentiment isn't just for damage control.
Use positive sentiment to find your biggest fans, source user-generated content, and understand what your audience loves most about your brand.
You can then piggyback on these themes and use them to inform your product and content strategy.
For instance, Crocs managed to shift the perception of Crocs from being "the end of fashion" to actually becoming a fashion item. They realized that people wanted more than just comfortable shoes.
This insight helped Crocs redefine their product and establish unconventional partnerships with celebrities like Diplo and brands like Balenciaga.

4. Competitive analysis and benchmarking
Competitive analysis helps you figure out where you stand in the social media landscape.
It shows how you perform against your rivals. It also lets you find gaps in your strategy and understand what resonates with customers in your sector.
What to look at:
Share of voice (how much of the conversation you own vs. competitors)
Engagement rates comparison
Follower growth rates
Content performance benchmarks
Sentiment comparison
Campaign effectiveness
Product launch impact
How to do it right:
Look at content your rivals publish, their brand messaging, how they present their products, and what stories they tell.
Then, conduct ongoing competitive benchmarking to check where you stand in the niche.
This means tracking social media performance metrics like reach to find ideas and points of differentiation.
For example, are your competitors neglecting a platform where your audience is active? Is there a content type they're not leveraging?
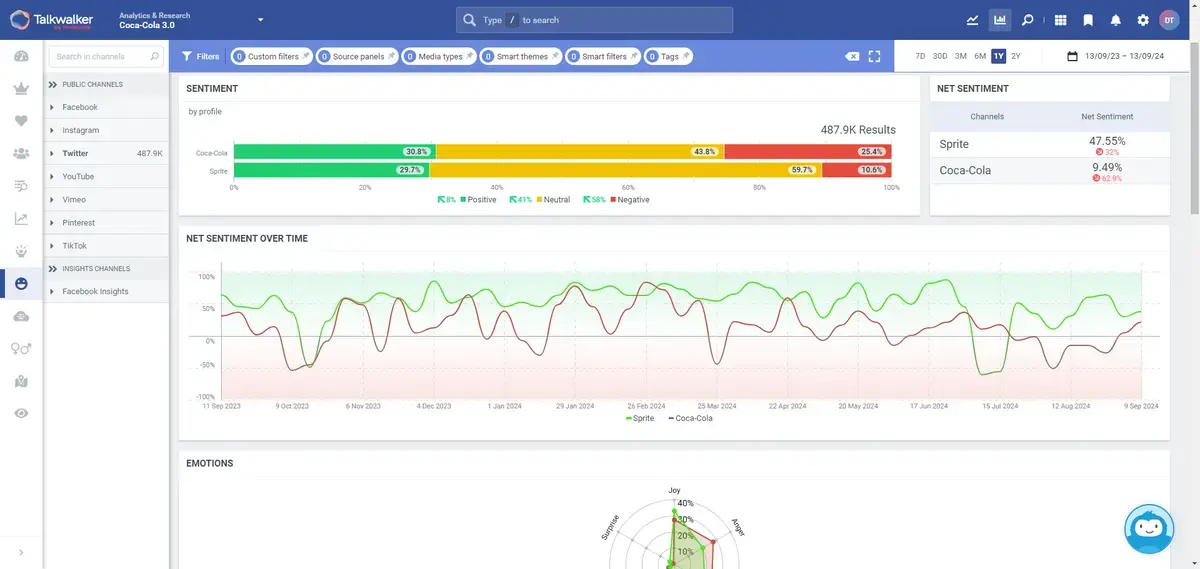
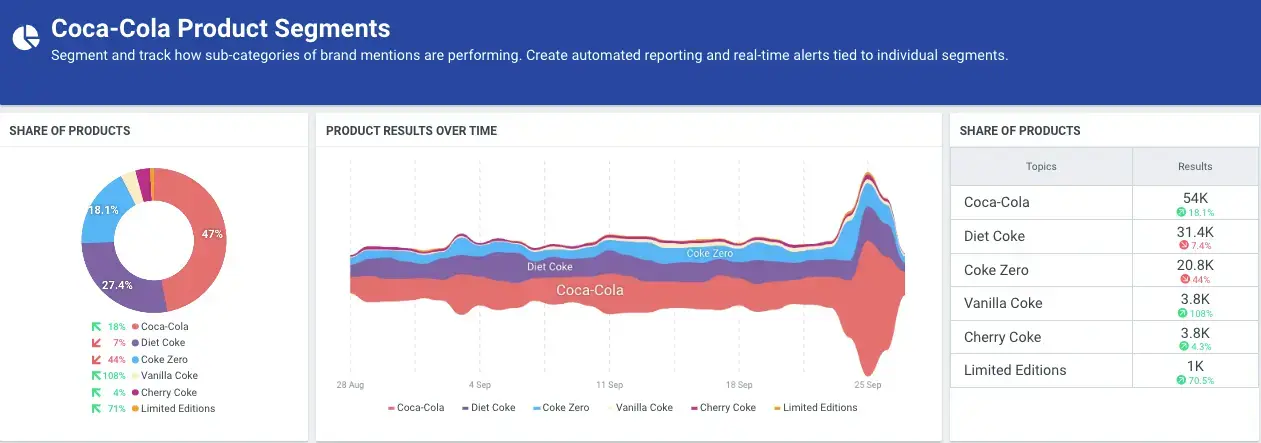
Tools like Talkwalker's Social Benchmarking can automate this process. Simply add your competitors and get regular in-depth benchmarking reports.
For instance, you can benchmark social media sentiment:
5. Paid social campaigns analytics
Social media paid campaigns are generally easier to measure and connect to business results.
That being said, they only perform well when you add ongoing tracking and optimization.
That’s why paid social analytics are essential.
What to look at:
Cost per click (CPC)
Click-through rate (CTR)
Conversion rate
Return on ad spend (ROAS)
Cost per acquisition (CPA)
Audience targeting effectiveness
Ad engagement rates
A/B test results
How to do it right:
Always start with clear goals for each campaign. For example, are you after brand awareness or leads?
Then, use these goals to track campaign performance.
If you don't run ads too often or only use one platform, the native campaign analytics in each channel could suffice.
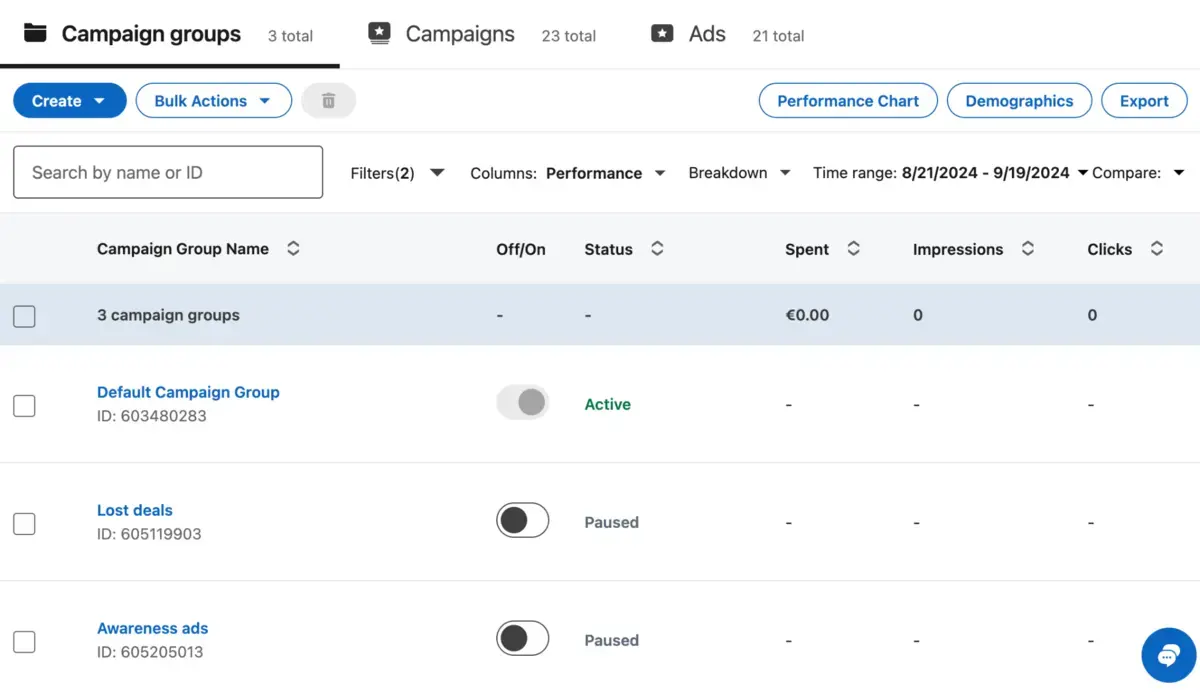
For example, here's what LinkedIn paid campaign analytics look like:
But what if you regularly manage social media ads and work with multiple channels?
In that case, use a specialized tool to save time and get a better grasp of useful campaign insights.
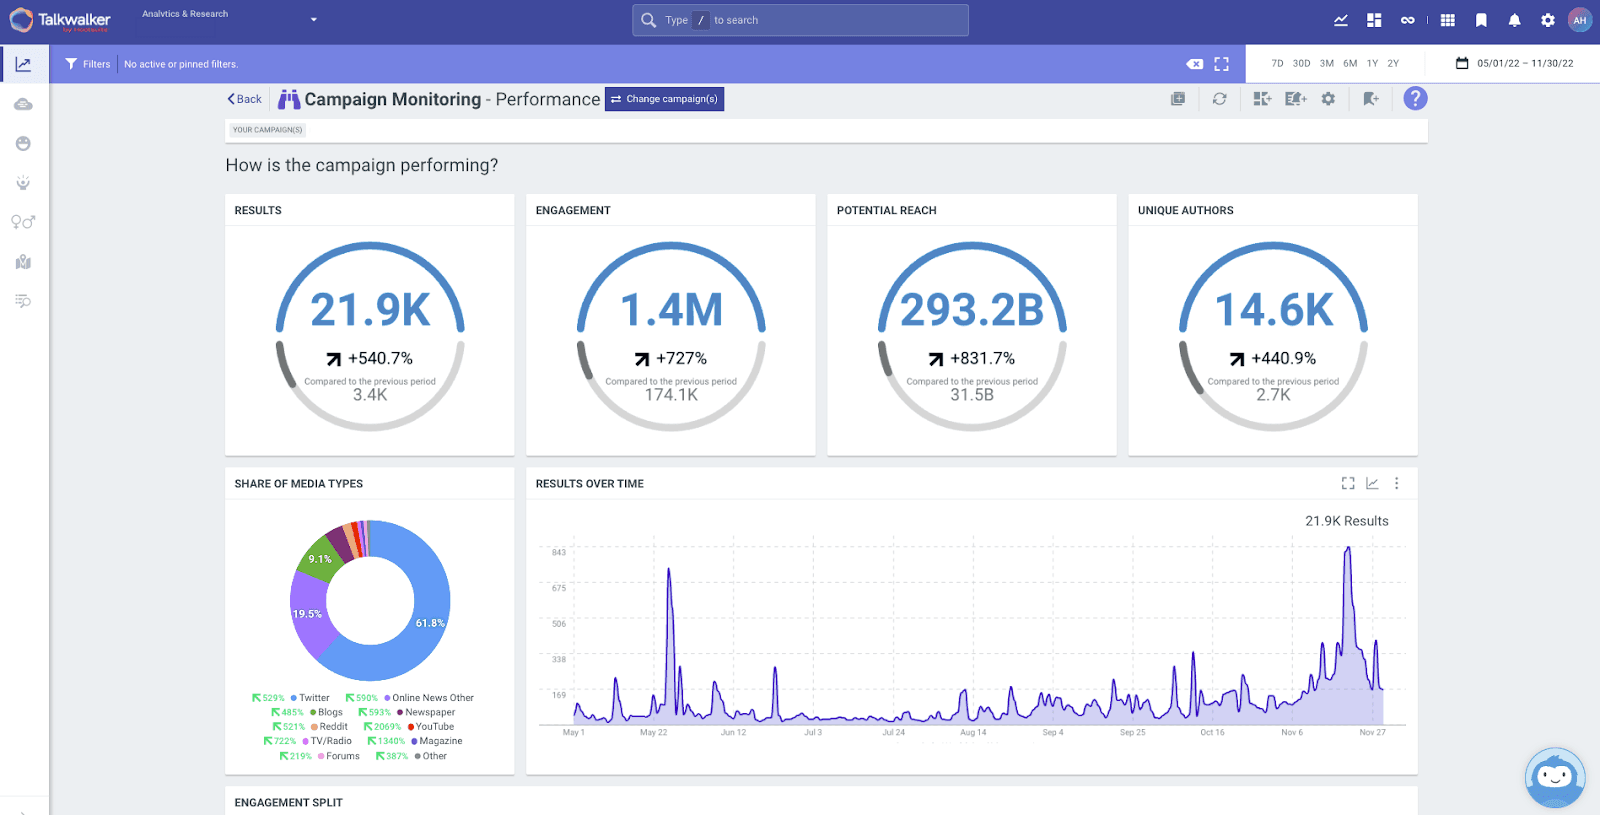
Here's what the paid analytics dashboard looks like in Talkwalker:
Remember, the goal of paid social analytics isn't just to track ad spend.
It's to continuously optimize your campaigns. Regular analysis can help you allocate your budget more effectively and ultimately drive better ROI from your ad spend.
6. Influencer analytics
Here’s another question that won’t social media managers sleep: How do you know if your influencer campaigns are paying off?
Just like with everything else, you set specific goals—and track them.
No need to change our mind about this:

Source: Markerly
What to look at:
Influencer reach and engagement rates
Audience overlap (between influencer and brand)
Content performance of influencer posts
Sentiment around influencer collaborations
Conversion rates from influencer content
ROI of influencer partnerships
Brand mention quality and frequency
How to do it right:
It's very common to launch influencer collaborations without specific KPIs.
You’ll get some reach, some likes; what could go wrong?
The problem is: as a result, influencer marketing is seen as a channel that doesn't bring revenue.
But that's mostly due to the lack of tracking and optimization.
So, always keep in mind what you're after:
Awareness and reach
Followers and engagement
Website traffic
Purchases
Improved brand image
Or something else.
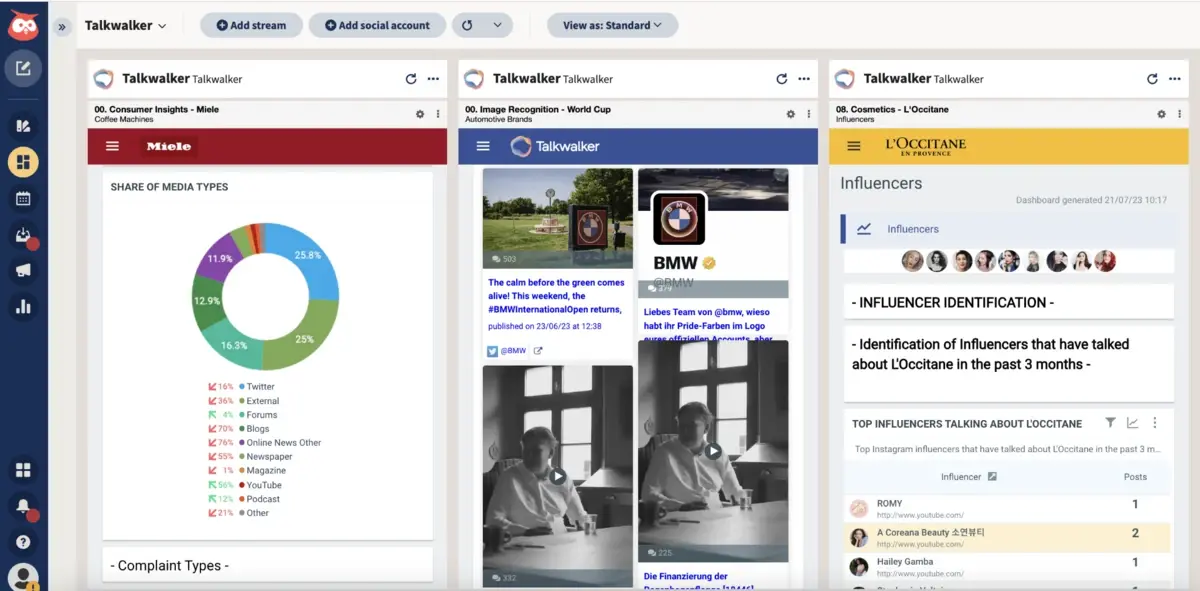
Similar to other social media analytics, we recommend using a specialized platform to track influencer marketing performance.
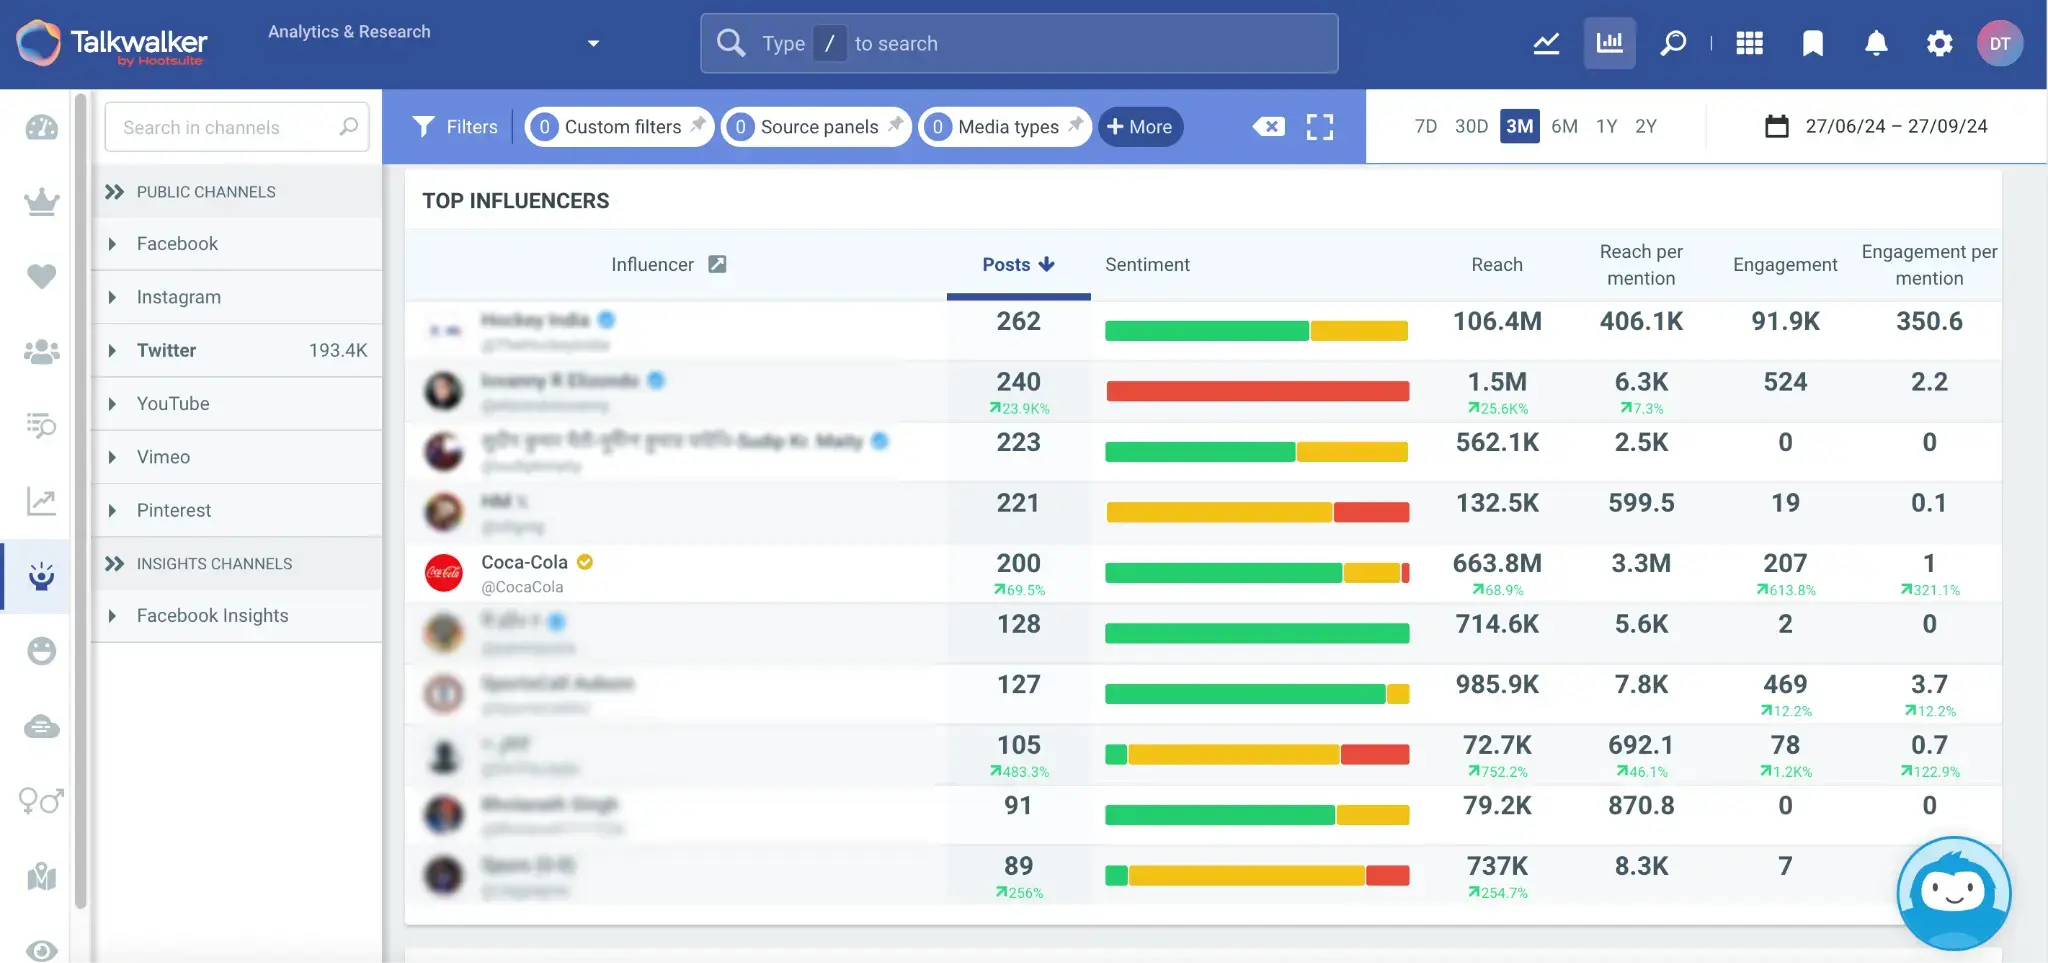
Talkwalker makes this task easy, too:
7. Response rate and time
Finally, social media is also a place where you interact with your audiences.
Proactively answering to comments, questions, and mentions helps you build a positive reputation and avert potential crises.
It can even potentially make you go viral. Like it happens with brands like Burger King and Wendy’s:
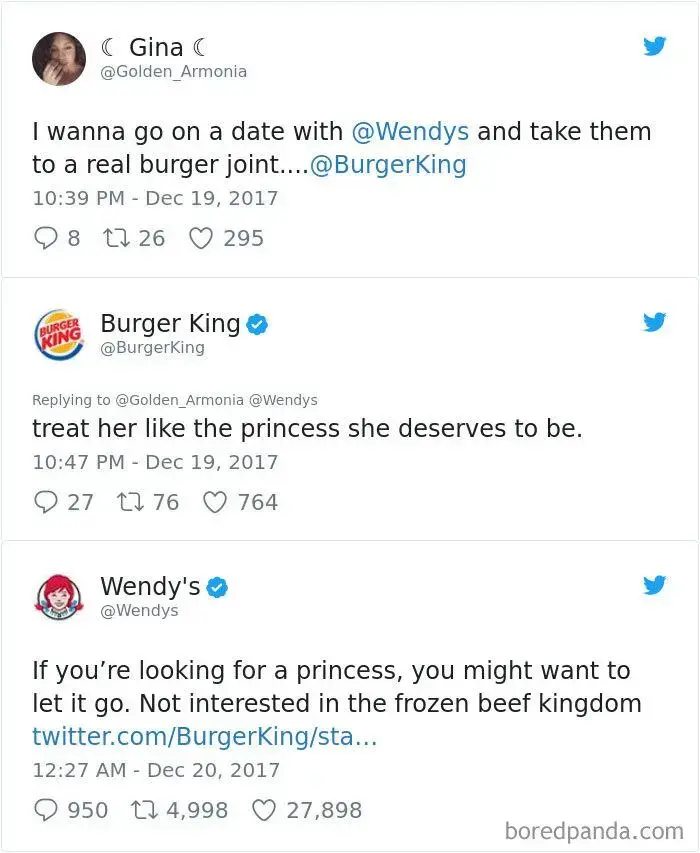
Source: Boredpanda.com
What to look at:
Response rate (percentage of messages you answer)
Average response time
First response time
Resolution time (for customer service issues)
Response quality (are you actually solving problems?)
Volume of incoming messages
Peak times for incoming messages
How to do it right:
First things first: set clear standards for your team. What's your target response time? How many messages should you be answering?
Most social media management tools offer analytics for these metrics. Here's what it might look like in action if you use Talkwalker:
However, don't get too hung up on speed. Quick replies are great, but make sure you're actually solving customer issues.
Pay attention to what questions pop up most often—you might need an FAQ or chatbot to handle common queries more efficiently.
And, look for a social media specialist who can come up with creative responses and translate your brand personality on all social channels.
How to set up effective social media analytics?
So, how do you build a process for tracking the right social media metrics? Let’s explore the key steps.
1. Define your goals and KPIs
First, ask yourself: What do you actually want to achieve with social media?
Your goals should align with your overall business objectives. Are you looking to:
Boost brand awareness?
Drive website traffic?
Generate leads?
Increase sales?
Improve customer satisfaction?
Be specific.
Instead of "increase followers," try "grow our Instagram following by 20% this quarter."
Remember, your goals might also vary by platform. LinkedIn could be a good channel for generating leads. And TikTok usually serves for brand awareness.
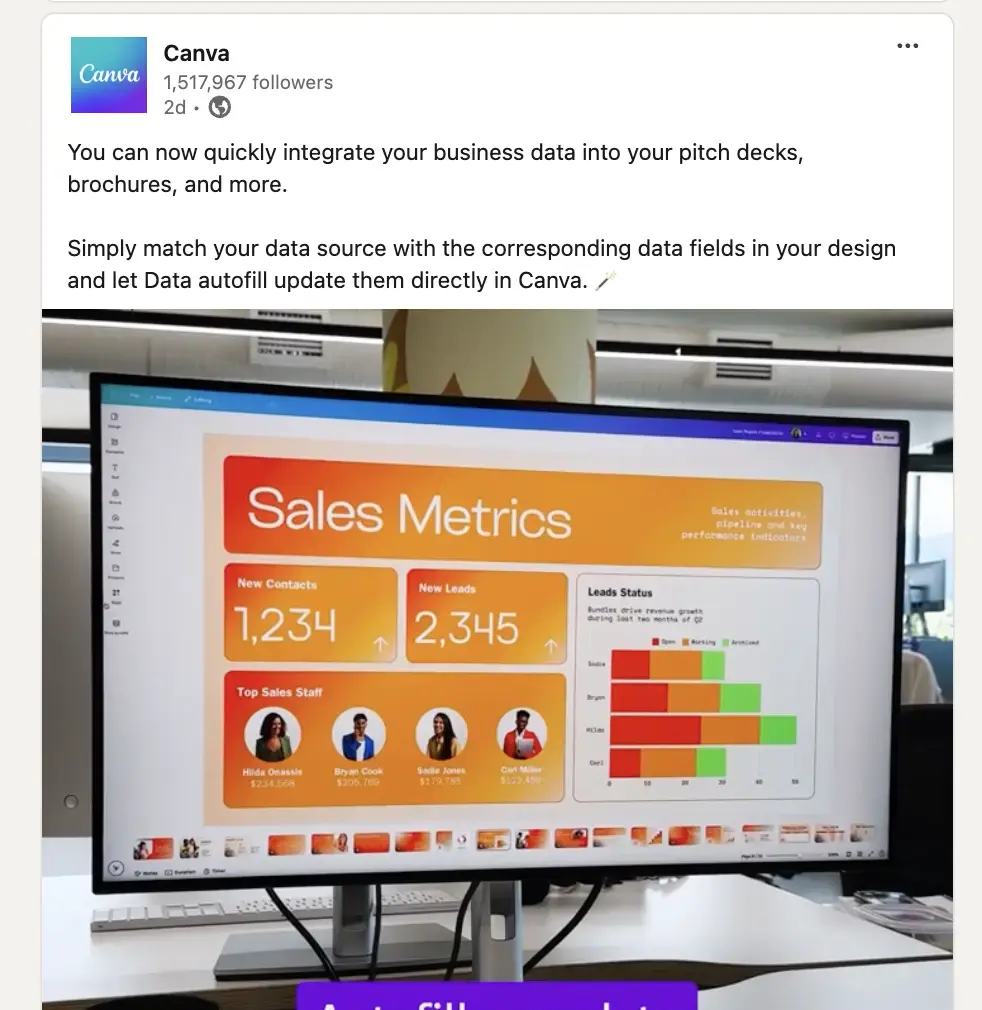
For example, Canva publishes lots of funny videos on its TikTok page and refers to social media trends in its content (“Things in Canva that are very demure”).
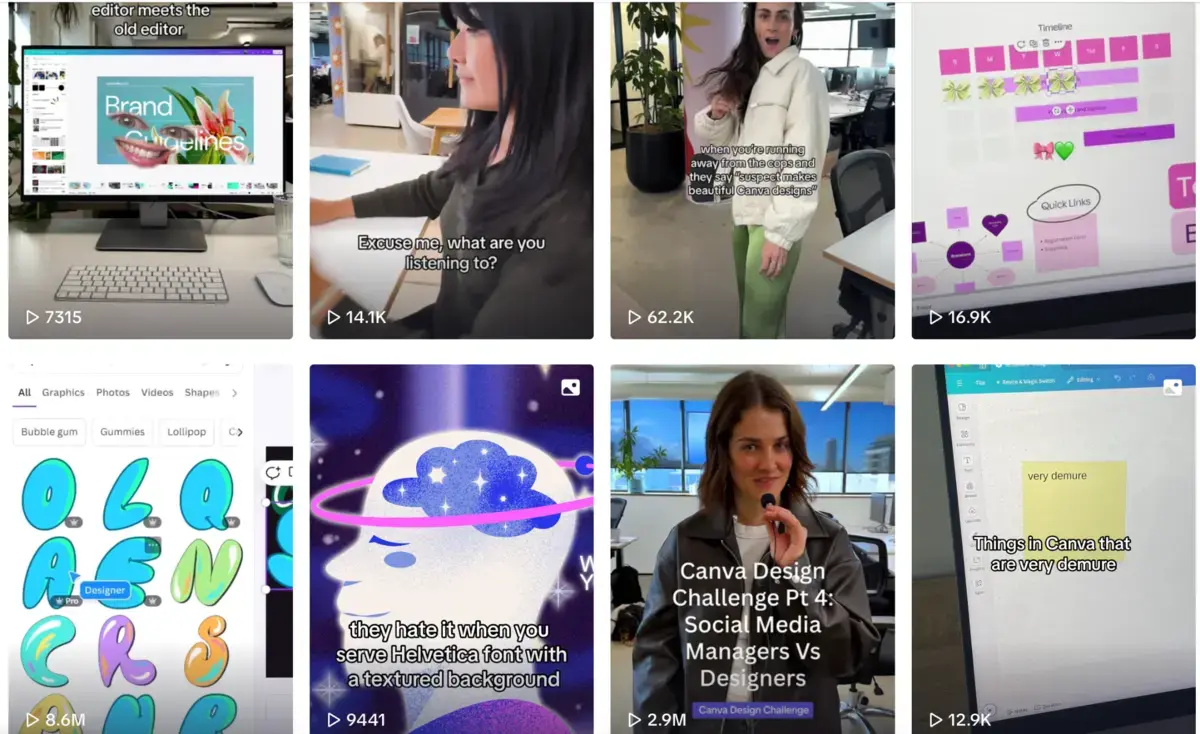
However, its LinkedIn content is much more serious and product-focused:
2. Select the right social media analytics tools
Next, think about your social media tech stack.
Remember, most social platforms offer free built-in analytics. Insights in Meta Business Suite, X (Twitter) Analytics, and LinkedIn Analytics are great starting points.
But working with fragmented data and multiple dashboards will inevitably get messy as you grow your social presence.
When that happens, consider switching to a more powerful tool.
For example, Talkwalker covers all sorts of social media data from each channel within the same platform:
Here’s how to choose the right software:
Match tools to your goals. For example, do you need detailed sentiment analysis? Look for AI-powered options.
Consider your budget. Free tools are great for small businesses, but larger brands need something more substantial.
Check for integration capabilities. Can the tool connect with your CRM or other marketing software?
Ease of use. Will your team actually use it? Look for intuitive interfaces and responsible customer support.
Remember, the best tool is the one you'll use consistently. Start small if you need to, and scale up over time.
3. Set up regular monitoring and reporting
One of the main challenges with social media analytics?
Companies invest in a tool, get excited about it…and forget about the whole thing.
Efficient social media analytics require a system for regular tracking and reporting.
This means documenting the whole process, generating regular reports, and having a person (or team) responsible for it. Here’s how to get it right:
Choose specific metrics tied to your goals. For example, it could be reach and impressions for brand awareness, and conversions for lead generation.
Create an SOP (Standard Operating Procedure) for tracking social media performance. It’s a document that specifies frequency (e.g., weekly and monthly reports), assigns roles, and lists specific steps required to collect and analyze the data.
Set up analytics dashboards. For example, you might have a dashboard for executive summaries, detailed performance per channel, audience, etc.
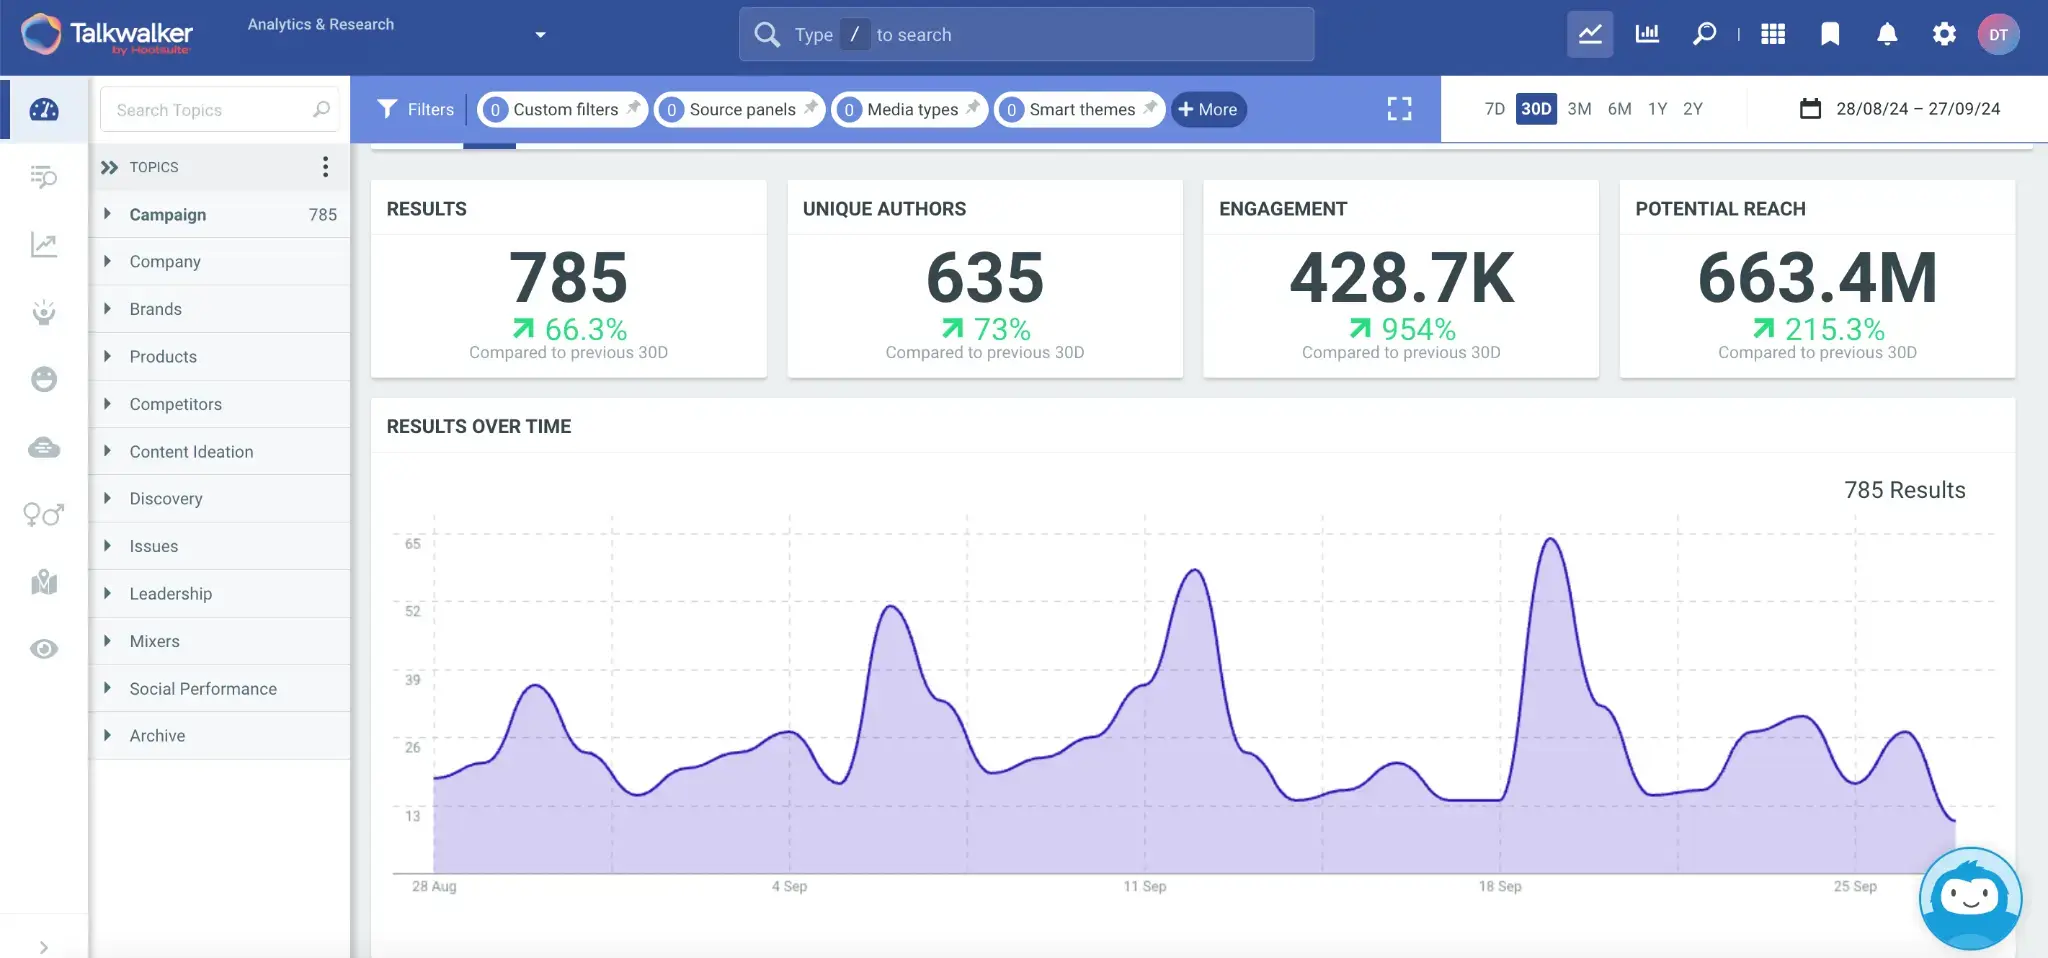
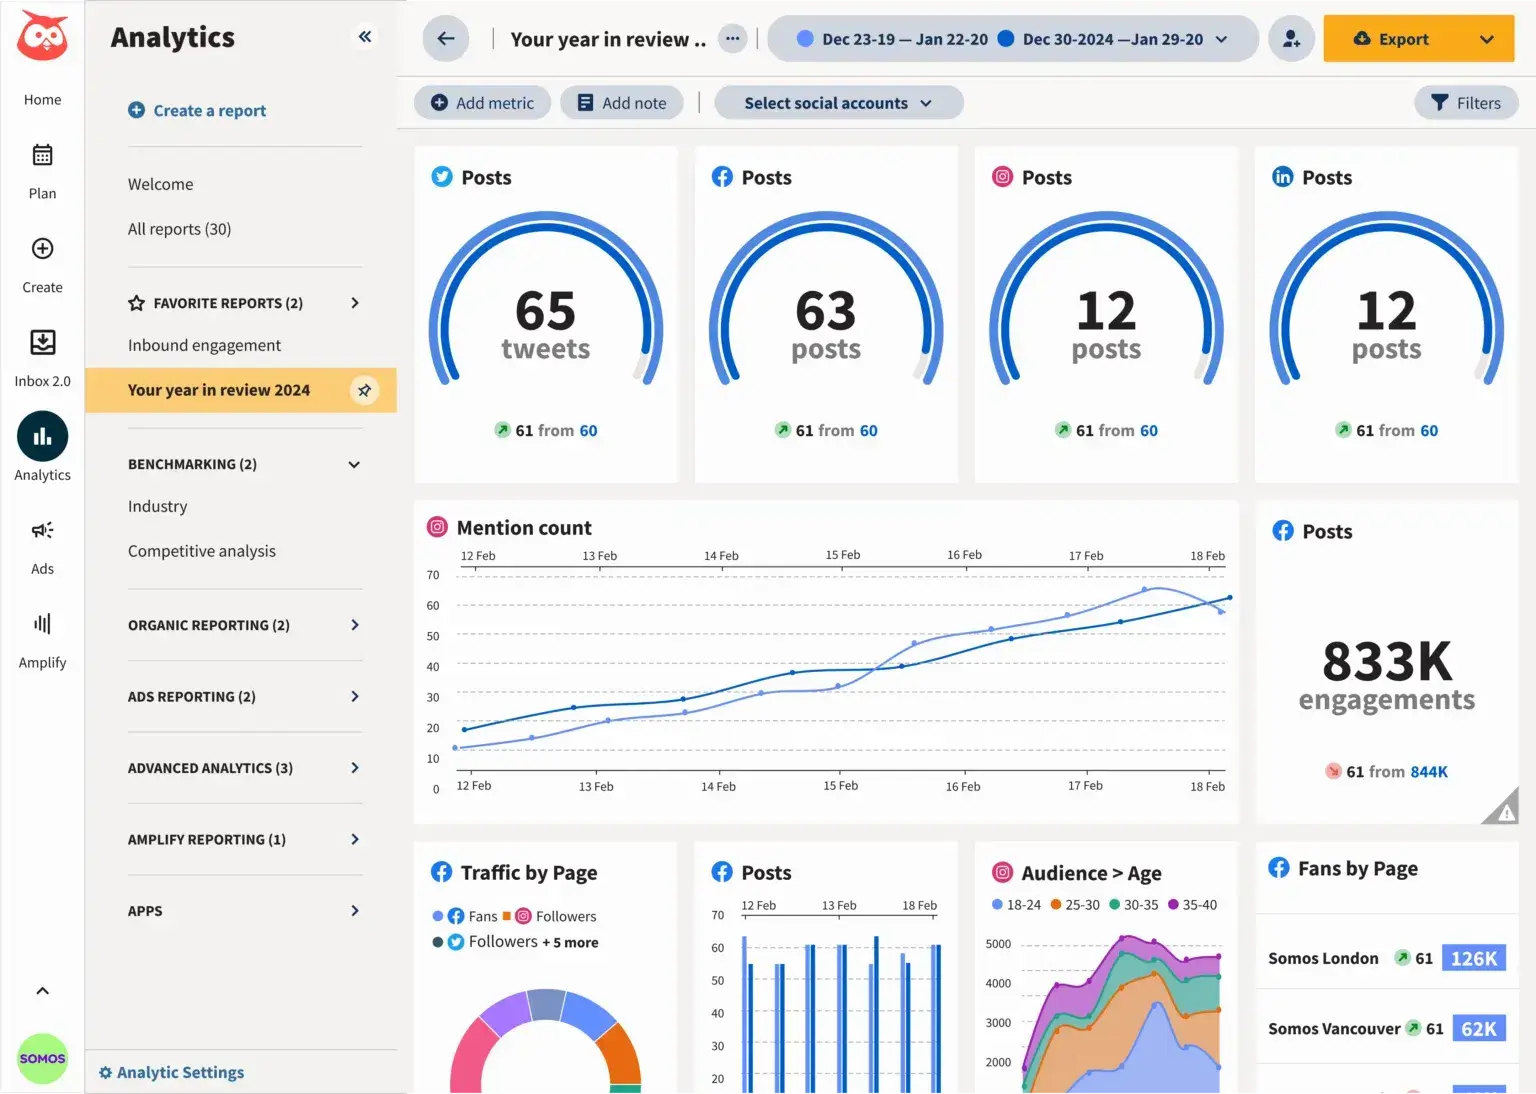
Tools like Talkwalker automate the last step for you. It has all the essential dashboards ready for your use and doesn’t require a lengthy setup.
All you need to do is click “Create new report” and specify data you need to generate.
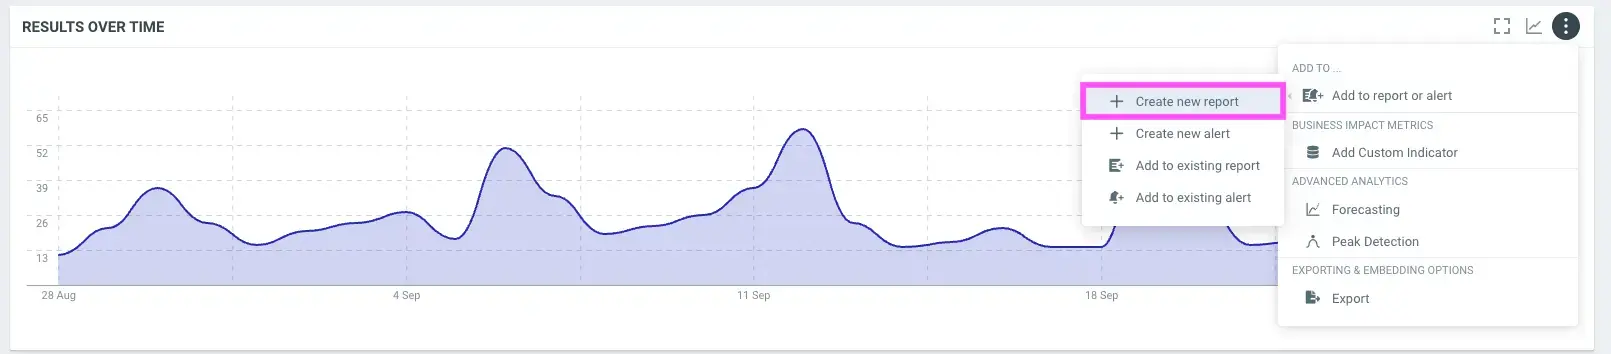
From here, the tool will create a ready-to-use dashboard you can customize as needed.
4. Analyze your competitors
Ongoing competitor analysis helps you get out of the box, generate ideas, and benchmark your social media performance.
Here’s how to do it:
First, list your main rivals. You will normally identify those during your market analysis.
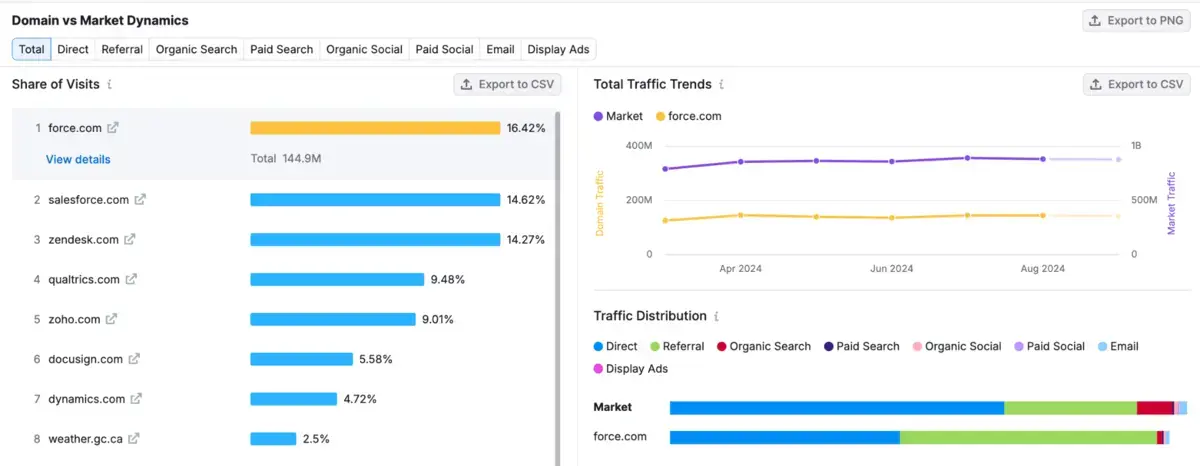
You can also use tools like Semrush’s Market Explorer to find websites that compete with you online.
Enter your domain, and it’ll generate a list of competitors and their shares of visits (percentage of a competitor’s traffic in the market’s traffic volume).
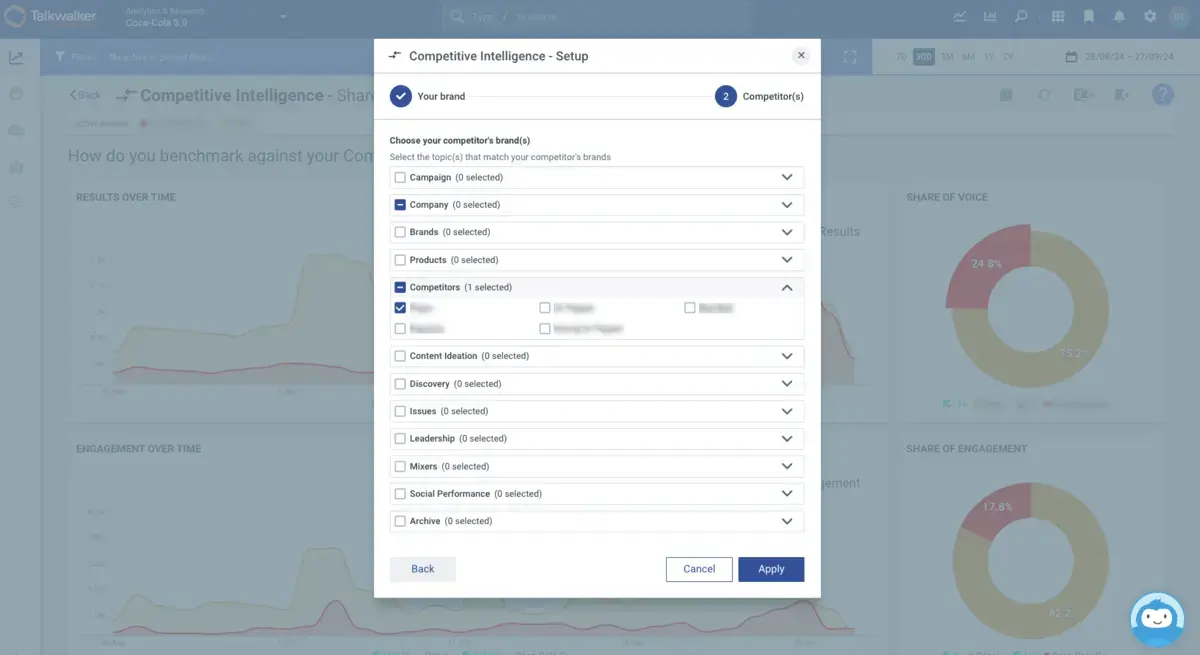
Next, add these competitors to your social media analytics tool.
In Talkwalker, head to the Competitive Intelligence tab, add your company, and list each competitor you want to track.
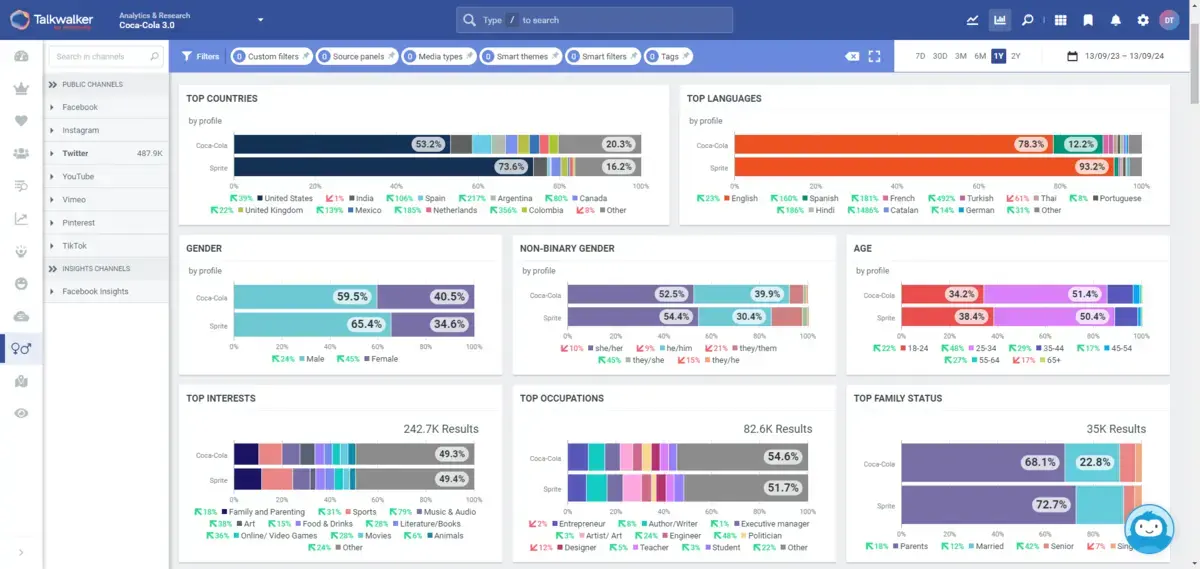
From here, head to the dashboards and start analyzing the key elements of their strategy. Look at:
Their overall performance over time
Content and topics that work well for them
Their audience profile, which is also easy to check with Talkwalker:
Finally, create a process to regularly track and benchmark their social media performance.
Analyze your competitors’ online sentiment, followers and engagement to assess where you stand in your niche.

Look for gaps and opportunities.
Perhaps, videos work really well for your rivals while you don’t post any.
Or, you might discover that they’re neglecting a platform where your audience is active—and seize the opportunity.
5. Adjust your social media strategy
Finally, use the analytics insights you collect to inform and optimize your strategy.
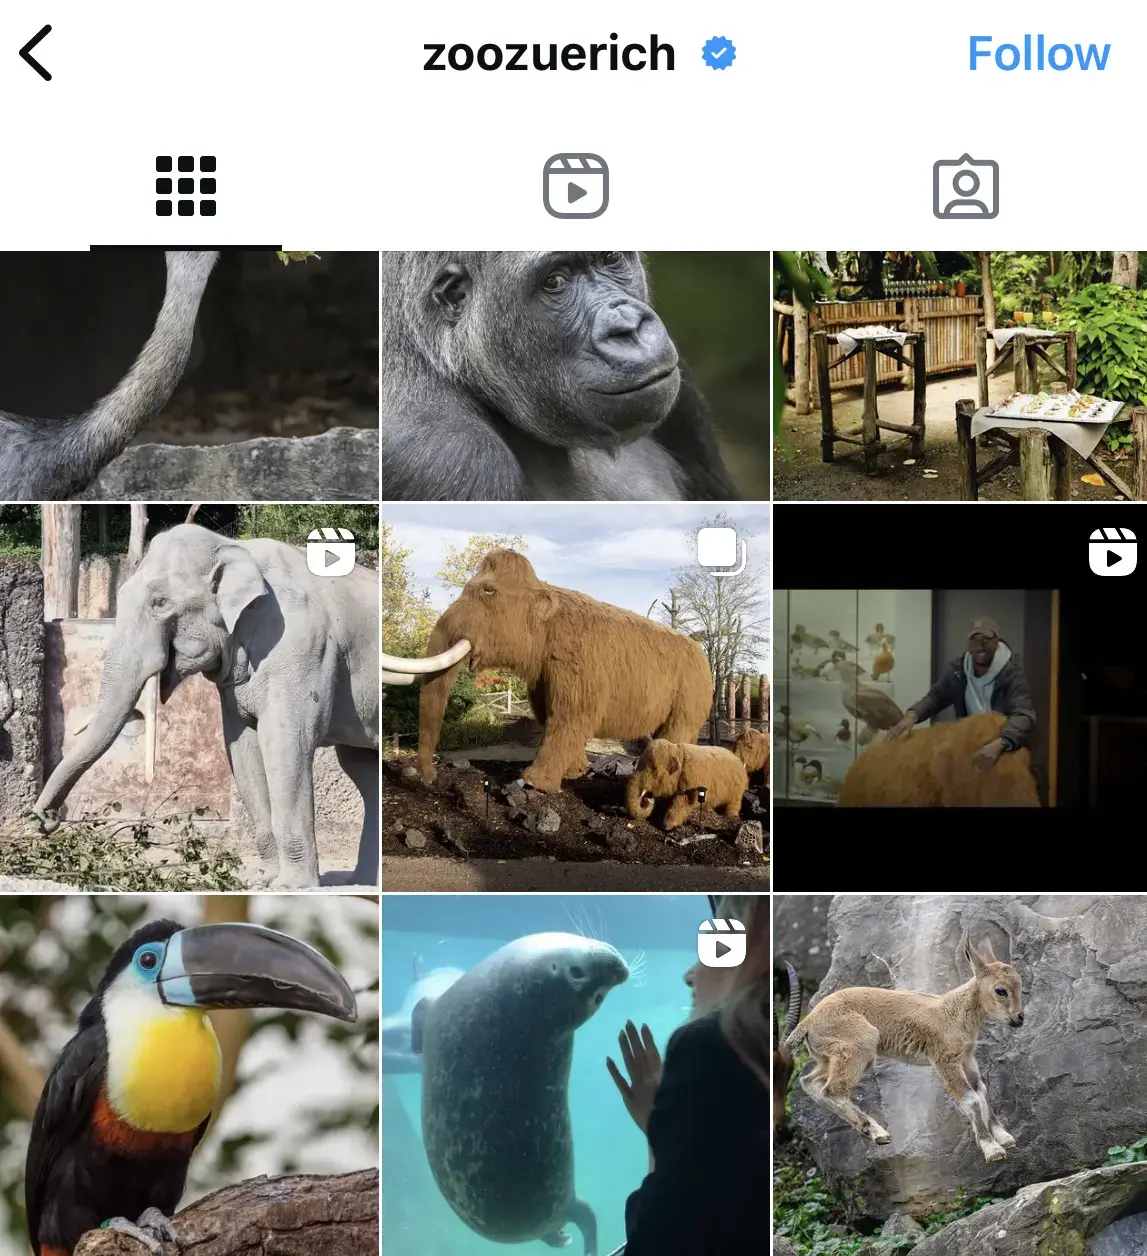
For example, Zoo Zurich uses Talkwalker to spot social media mentions in real time.
This allows them to engage with visitors' conversations and feature visitors' pictures on their own Instagram feed.
Here’s how you can use data to improve your own efforts:
Content tweaks. If your video posts are outperforming images, shift more resources to video production.
Posting schedule. Notice higher engagement on Tuesday and Wednesday mornings? Use this time to publish your key content.
Platform focus. If your TikTok is exploding while Meta stagnates, you know where to double down.
Audience targeting. Use demographic insights to refine your targeting and messaging.
Campaign adjustments. Low conversion rates on a campaign? Try to rethink the offer or your creatives.
What are the best social media analytics tools?
Accessing useful social media data is impossible without a powerful analytics tool.
Let's explore the most essential social media data platforms you can use.
1. Talkwalker
Price: Request a quote based on your needs
Best for: Large enterprises, mid market firms, and agencies looking for one-stop social analytics, social listening, and powerful competitive benchmarking
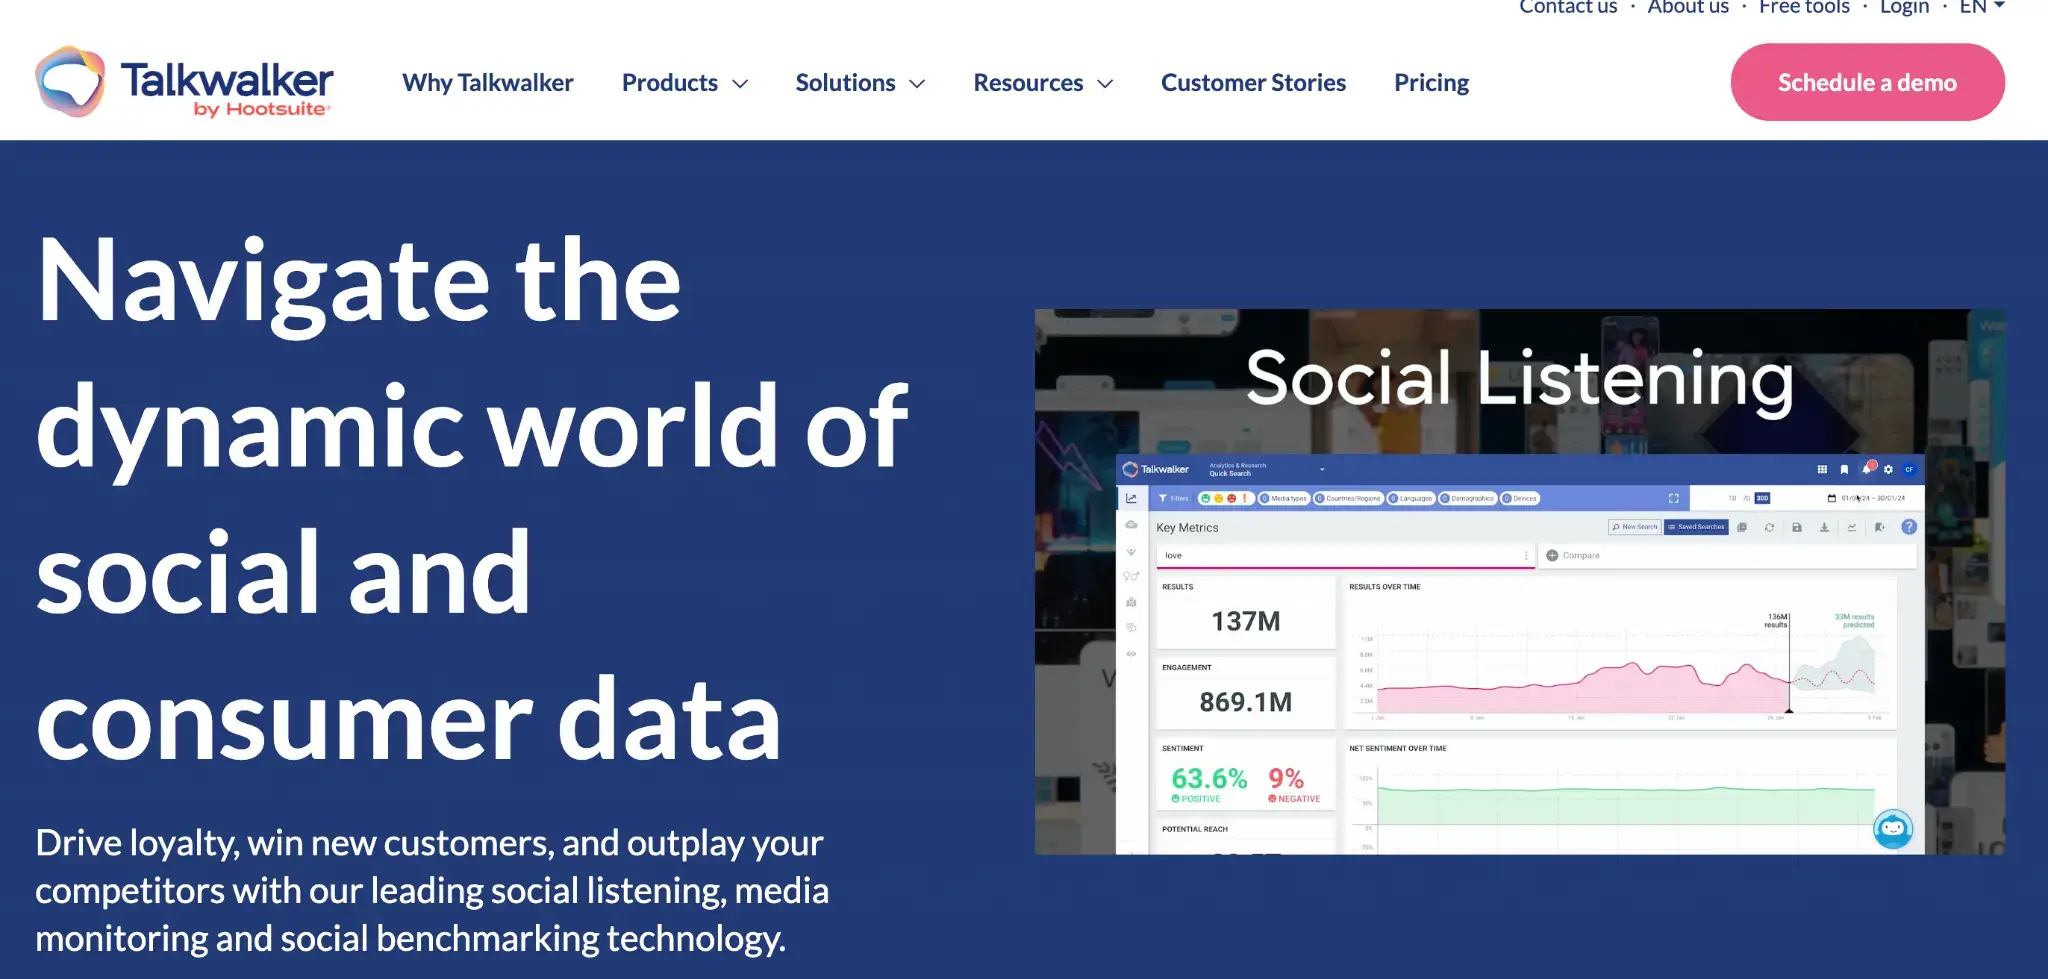
Talkwalker is a powerful social media analytics and consumer intelligence platform that covers pretty much everything you might need.
It helps you monitor your online presence, track competitors, identify trends, work with influencers, and gain deep insights into consumer behavior and sentiment.
The platform offers various AI features, including image and video recognition, which let you track visual online mentions (like brand logos) beyond just text.
It also uses AI to analyze consumer behavior patterns and surface nuanced insights from large datasets.
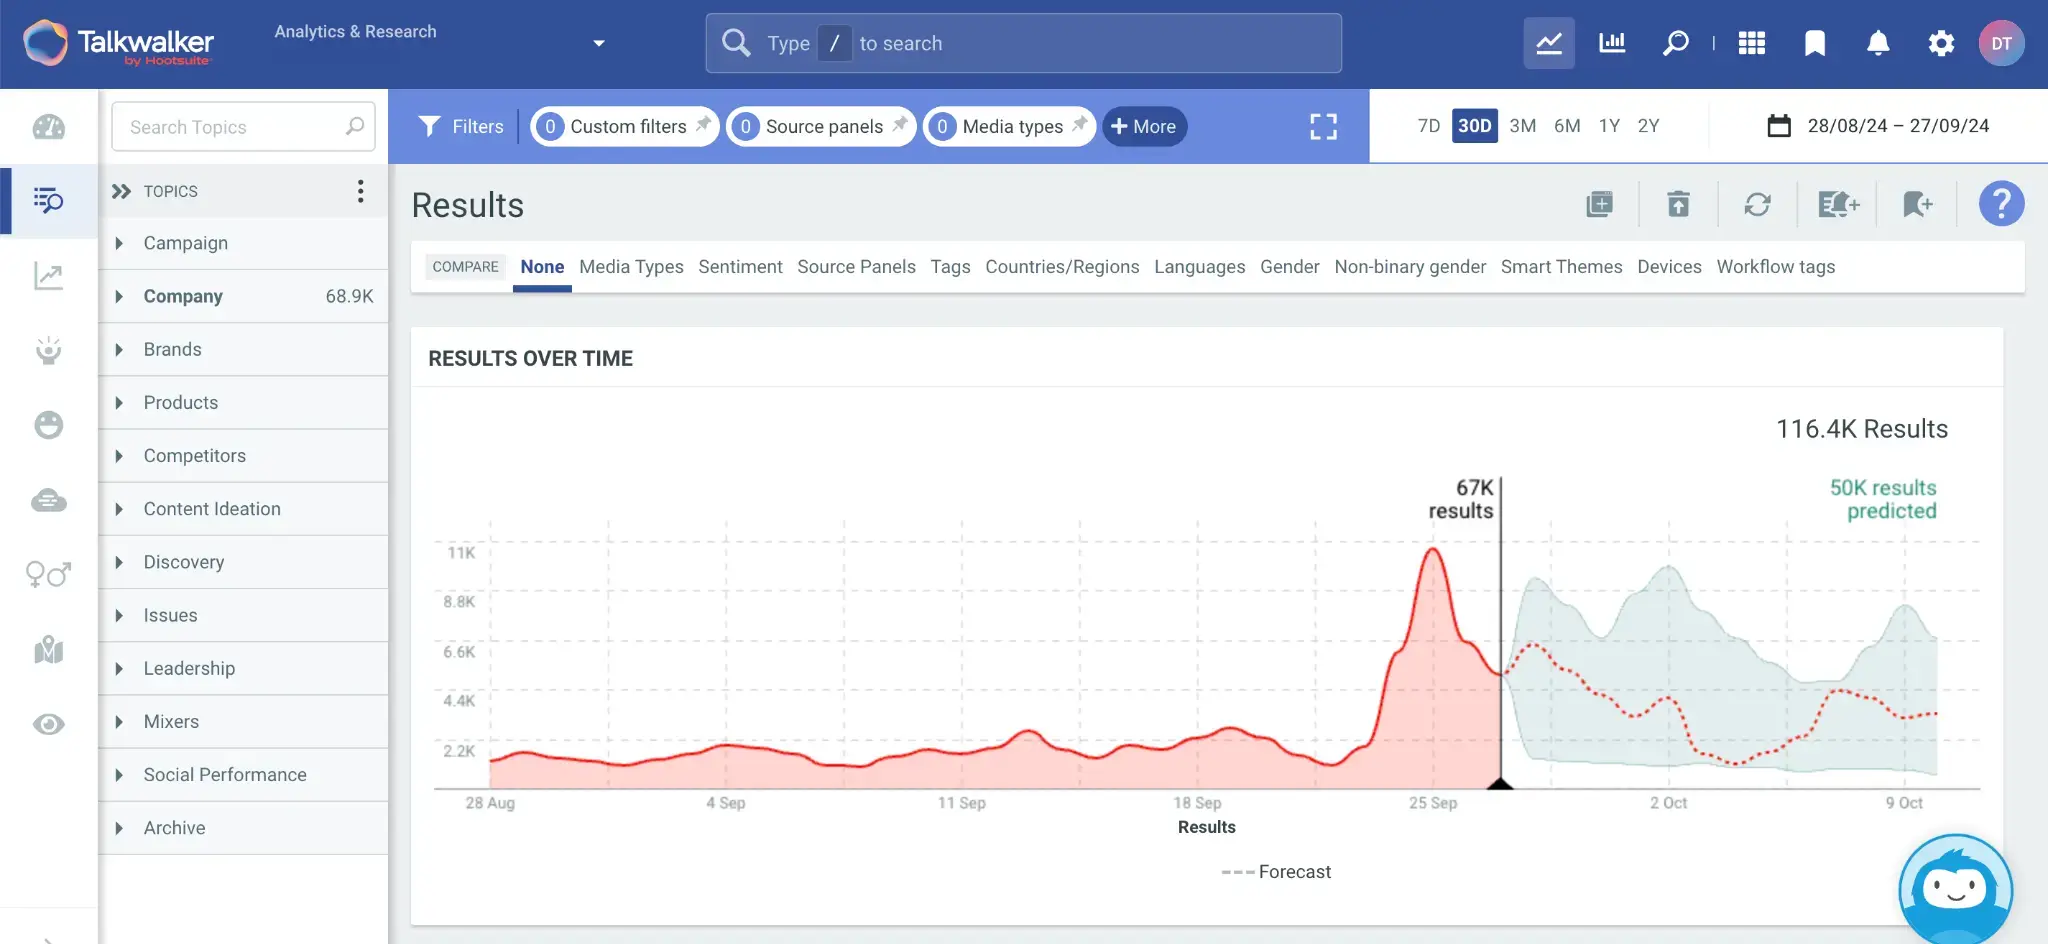
For example, its predictive analytics use AI to generate a 90-day forecast for conversations about your brand and product.
Talkwalker's key strength is its ability to handle large volumes of data and provide actionable insights through customizable dashboards and reports.
Choose this tool if you need comprehensive analytics for different social media channels and want to track your online competitors.
Key features:
Extensive data coverage across 30+ social platforms and 150 million websites
AI-powered image and video recognition
Sentiment analysis in 187 languages
Real-time alerts for brand mentions and potential crises
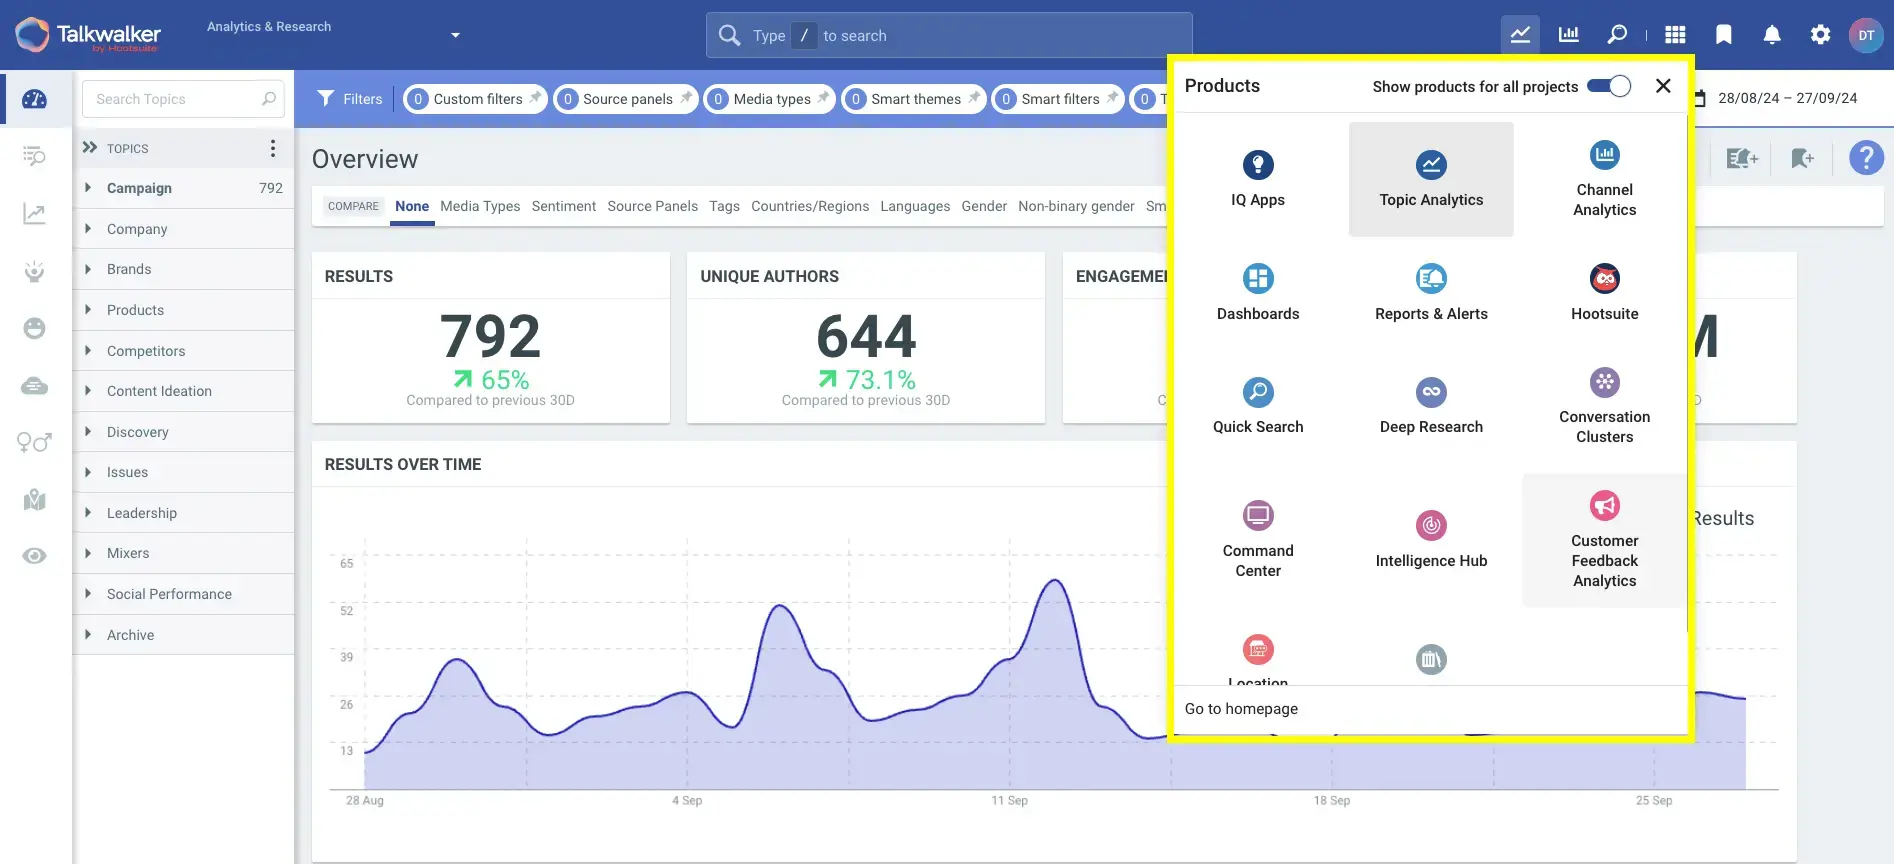
Customizable dashboards and IQ Apps for specific use cases (e.g., crisis management, competitive intelligence)
2. Hootsuite
Price: Starts at $99/month
Best for: Social media management and analytics for small to medium-sized businesses and agencies
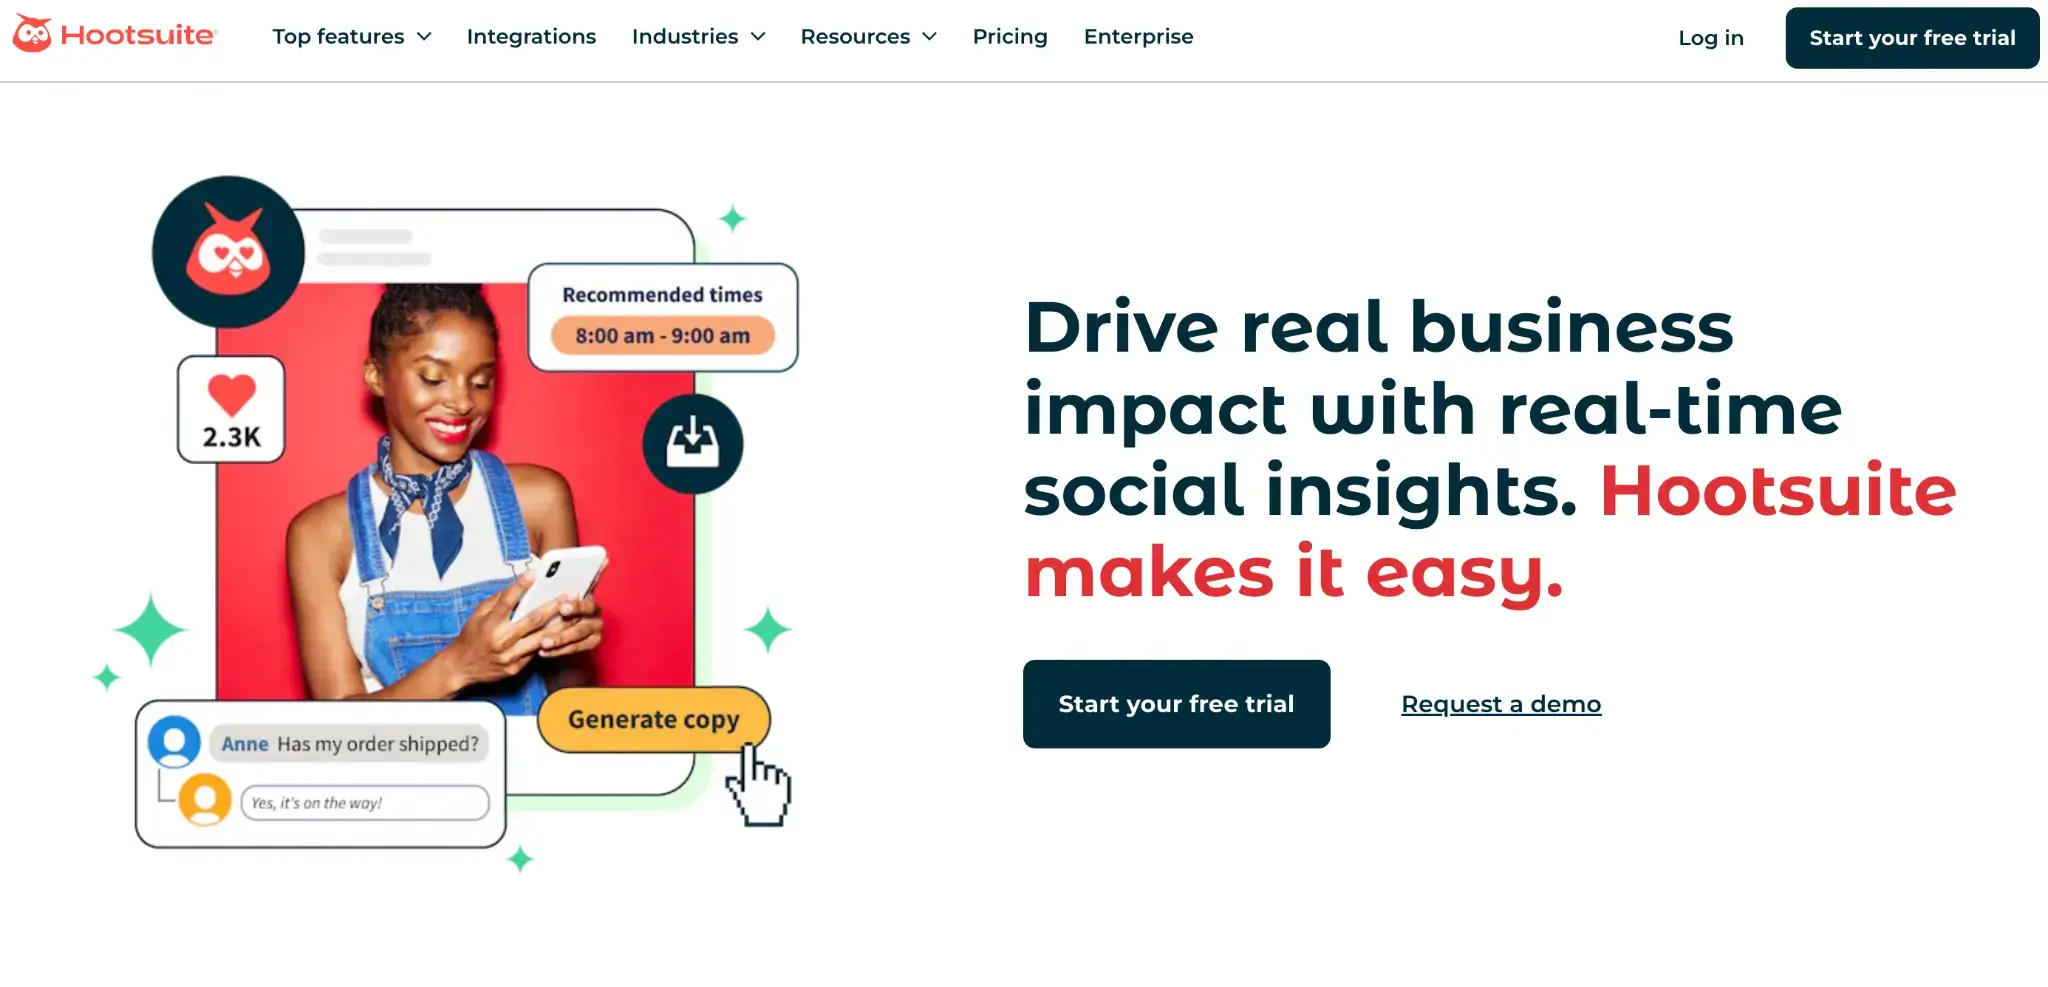
Hootsuite is a modern social media management platform with strong analytics features.
It centralizes your social media efforts, allowing you to manage and analyze accounts across Facebook, Instagram, X (formerly Twitter), LinkedIn, and Pinterest from one dashboard.
You can track key metrics like engagement rates and follower growth and get recommendations on the best times to post.
A standout feature is Hootsuite's integration with Talkwalker for social listening.
This lets you monitor brand mentions, keep an eye on competitors, and spot emerging trends in your industry.
Key features:
Unified dashboard for multiple social networks
Best time to post recommendations
Social listening powered by Talkwalker
Integration with web analytics (Google Analytics and Adobe Analytics)
AI-powered content suggestions (OwlyWriter AI)
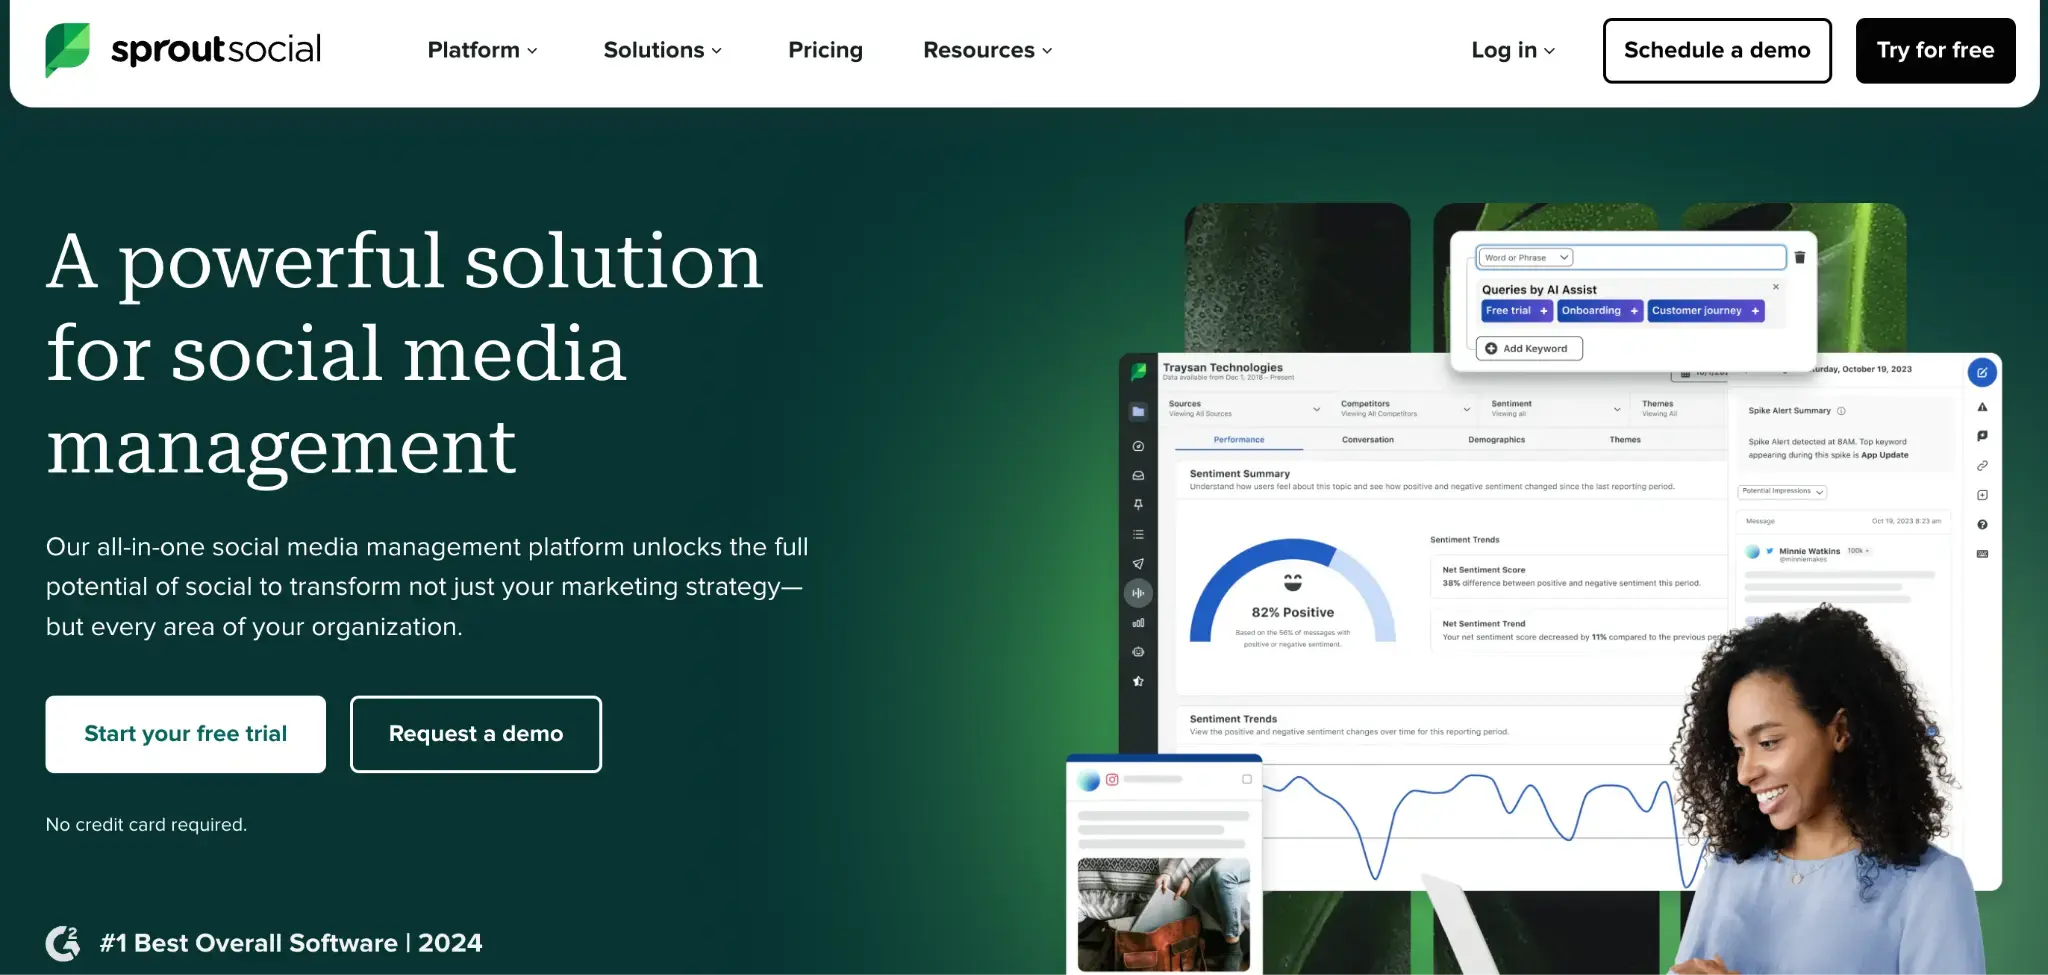
3. Sprout Social
Price: Starts at $249 per seat/month
Best for: Businesses looking for advanced custom analytics
Sprout Social is an all-in-one social media management platform that helps with publishing, analytics, and social listening.
One of Sprout's top features is its AI-powered workflows, which help you save time and provide better access to actionable data.
Sprout Social also offers premium analytics features for those who need more advanced reporting capabilities.
These include customizable reports, interactive charts and graphs, and advanced filtering options to spotlight the metrics that matter most for your business.
Key features:
AI-enhanced agent replies for faster customer service
Customizable reports and analytics
Social listening tools
Integration with major social networks and CRM platforms
Influencer marketing tools
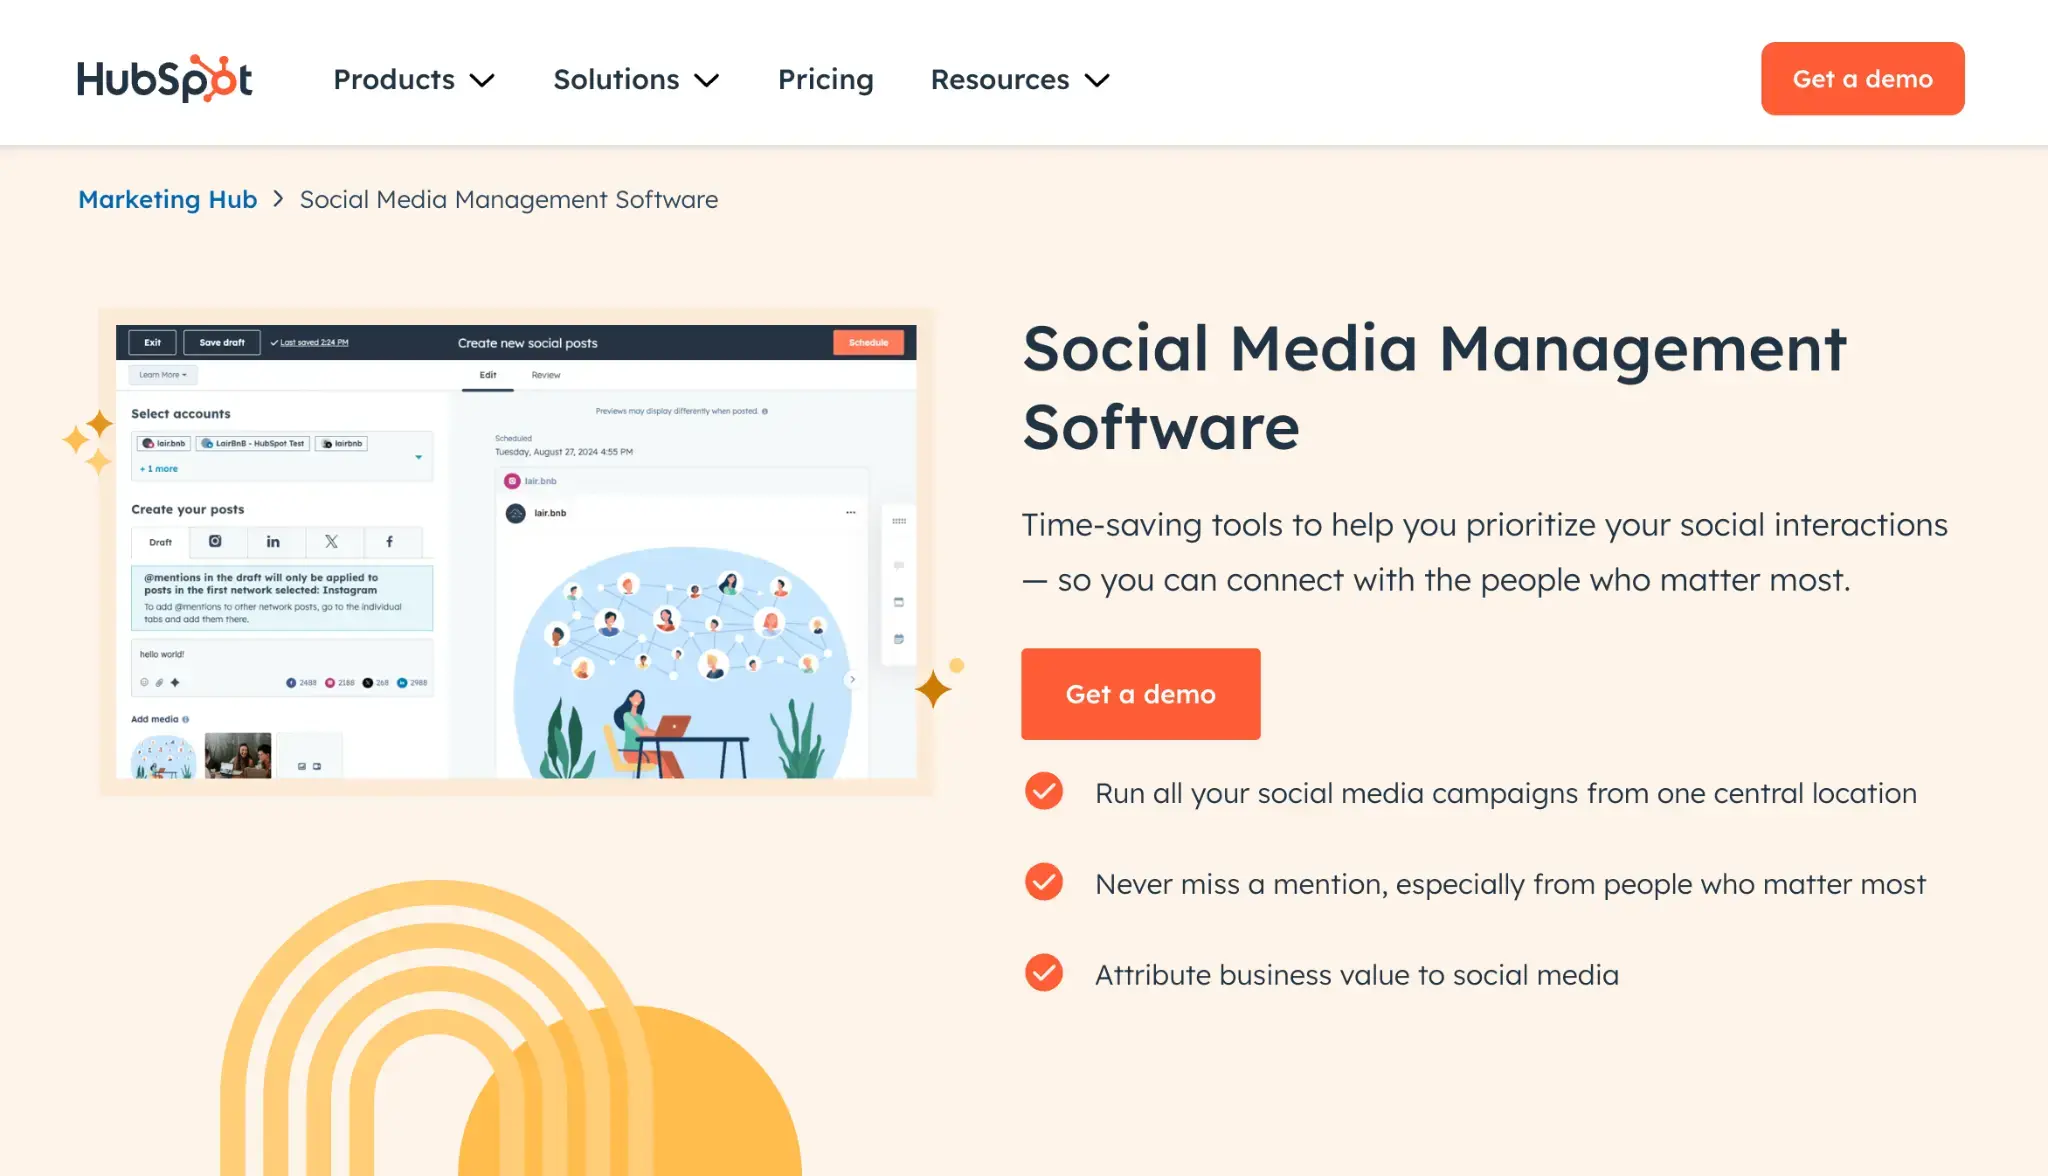
4. HubSpot
Price: Starts at €880/month for the Marketing Hub
Best for: Small and medium businesses looking for a one-stop CRM and marketing tool that covers social media
HubSpot is a CRM, inbound marketing, sales, and customer service platform.
While it's not exclusively a social media tool, it offers various social media management features as part of its Marketing Hub.
Hubspot provides a unified dashboard for managing marketing activities, including social media, email marketing, content management, and analytics.
Its key feature is its integration with other marketing and sales tools within the platform.
This allows you to tie social media efforts directly to lead generation, customer relationships, and overall marketing ROI.
Key features:
Social media publishing and monitoring across major platforms
AI-powered social post generator (in beta)
Integration with HubSpot's CRM for deeper insights into social interactions
Built-in analytics and reporting on social media ROI
Breeze Social Media Agent for AI-enhanced social media management
5. Channelview Insights by Synaptive
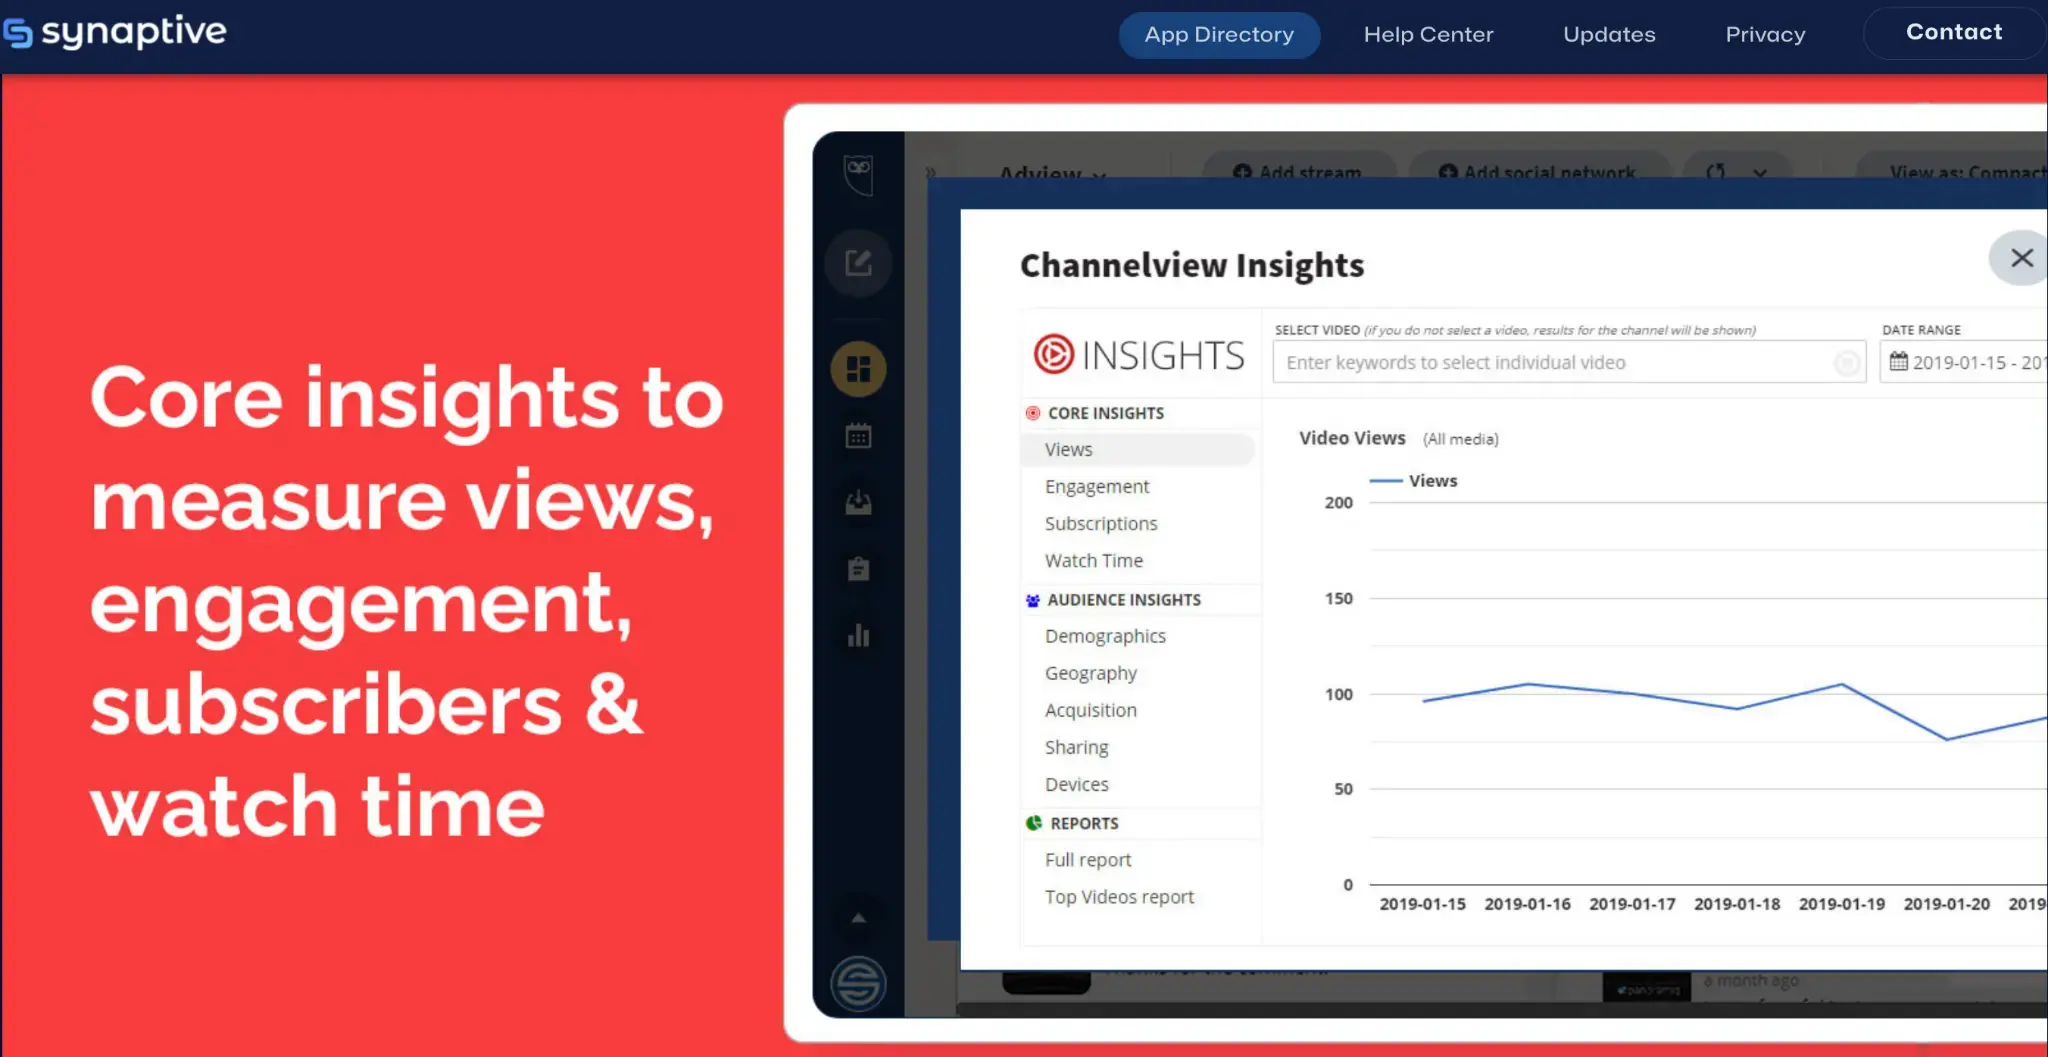
Price: Starts at $8/month (Free for Hootsuite Enterprise users)
Best for: YouTube content creators and marketers with a strong focus on video marketing
Channelview Insights is a Hootsuite app that focuses specifically on YouTube analytics.
It provides in-depth insights into your YouTube channel performance, making it an excellent choice if you want to prioritize video content in your social media strategy.
The app integrates directly into your Hootsuite dashboard, allowing you to analyze your YouTube channels alongside your other social media platforms.
Channelview generates insights for both core analytics (views, engagement, subscriber growth) and audience insights (demographics, geography, acquisition).
Key features:
Core analytics for views, engagement, and subscription activity for YouTube
Audience insights including demographics and geography
Custom report creation in PDF and CSV formats
Easy integration with Hootsuite dashboard
Historical data analysis with customizable date ranges
6. Upfluence
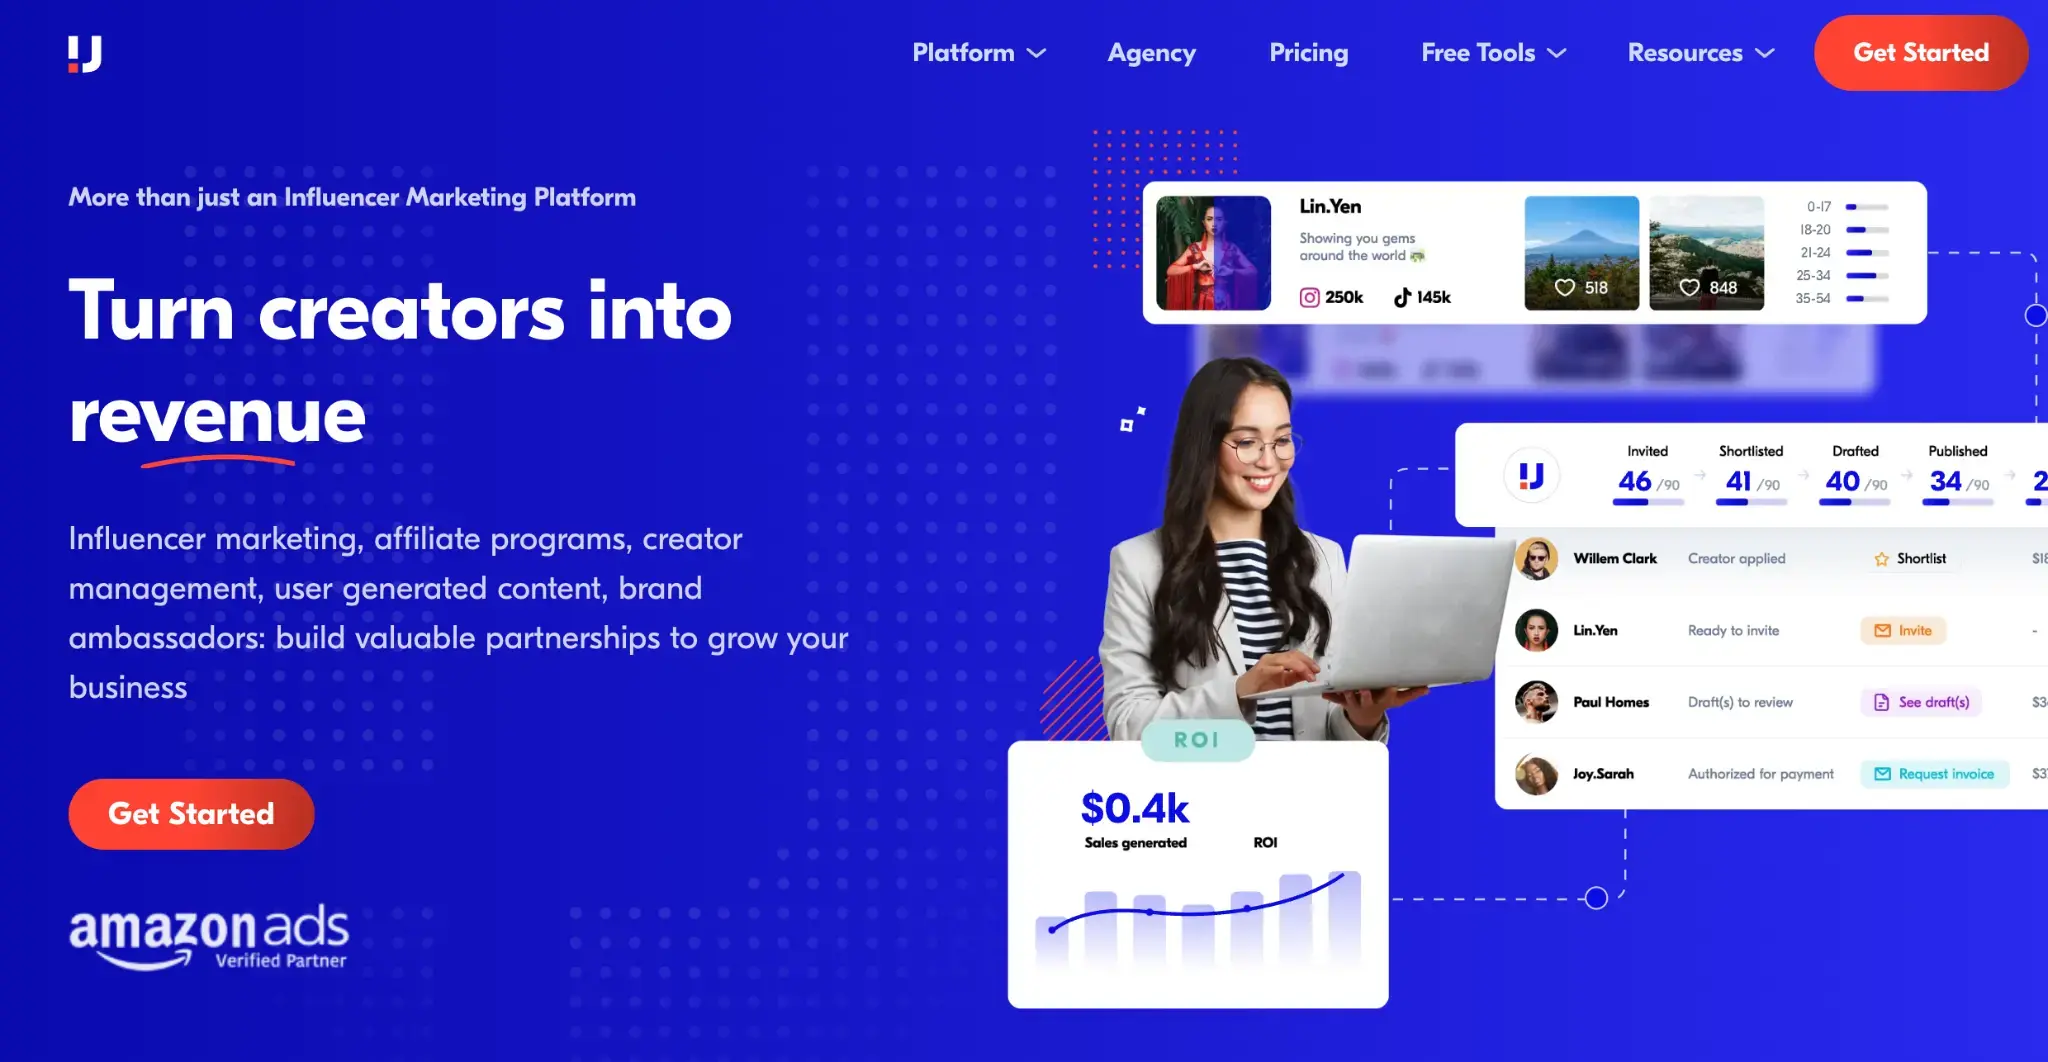
Price: Not publicly disclosed. Contact for custom pricing.
Best for: Brands and agencies focusing on influencer marketing and affiliate programs
Upfluence is an influencer marketing platform that covers everything from finding the right influencers to analyzing campaign performance.
It helps you launch profitable influencer marketing projects, affiliate programs, and brand ambassador initiatives.
The platform can identify creators who are already customers or fans of your brand, which leads to more authentic partnerships.
Upfluence also offers integration with e-commerce platforms and lets you track sales directly attributed to influencer partnerships.
This allows for more accurate ROI measurement and performance-based compensation for creators.
Key features:
AI-powered influencer discovery, including existing customers
Sales tracking and ROI measurement
Content performance analytics across multiple platforms
Social listening tools for brand mention monitoring
Customizable reporting dashboards
7. Google Analytics (GA4)
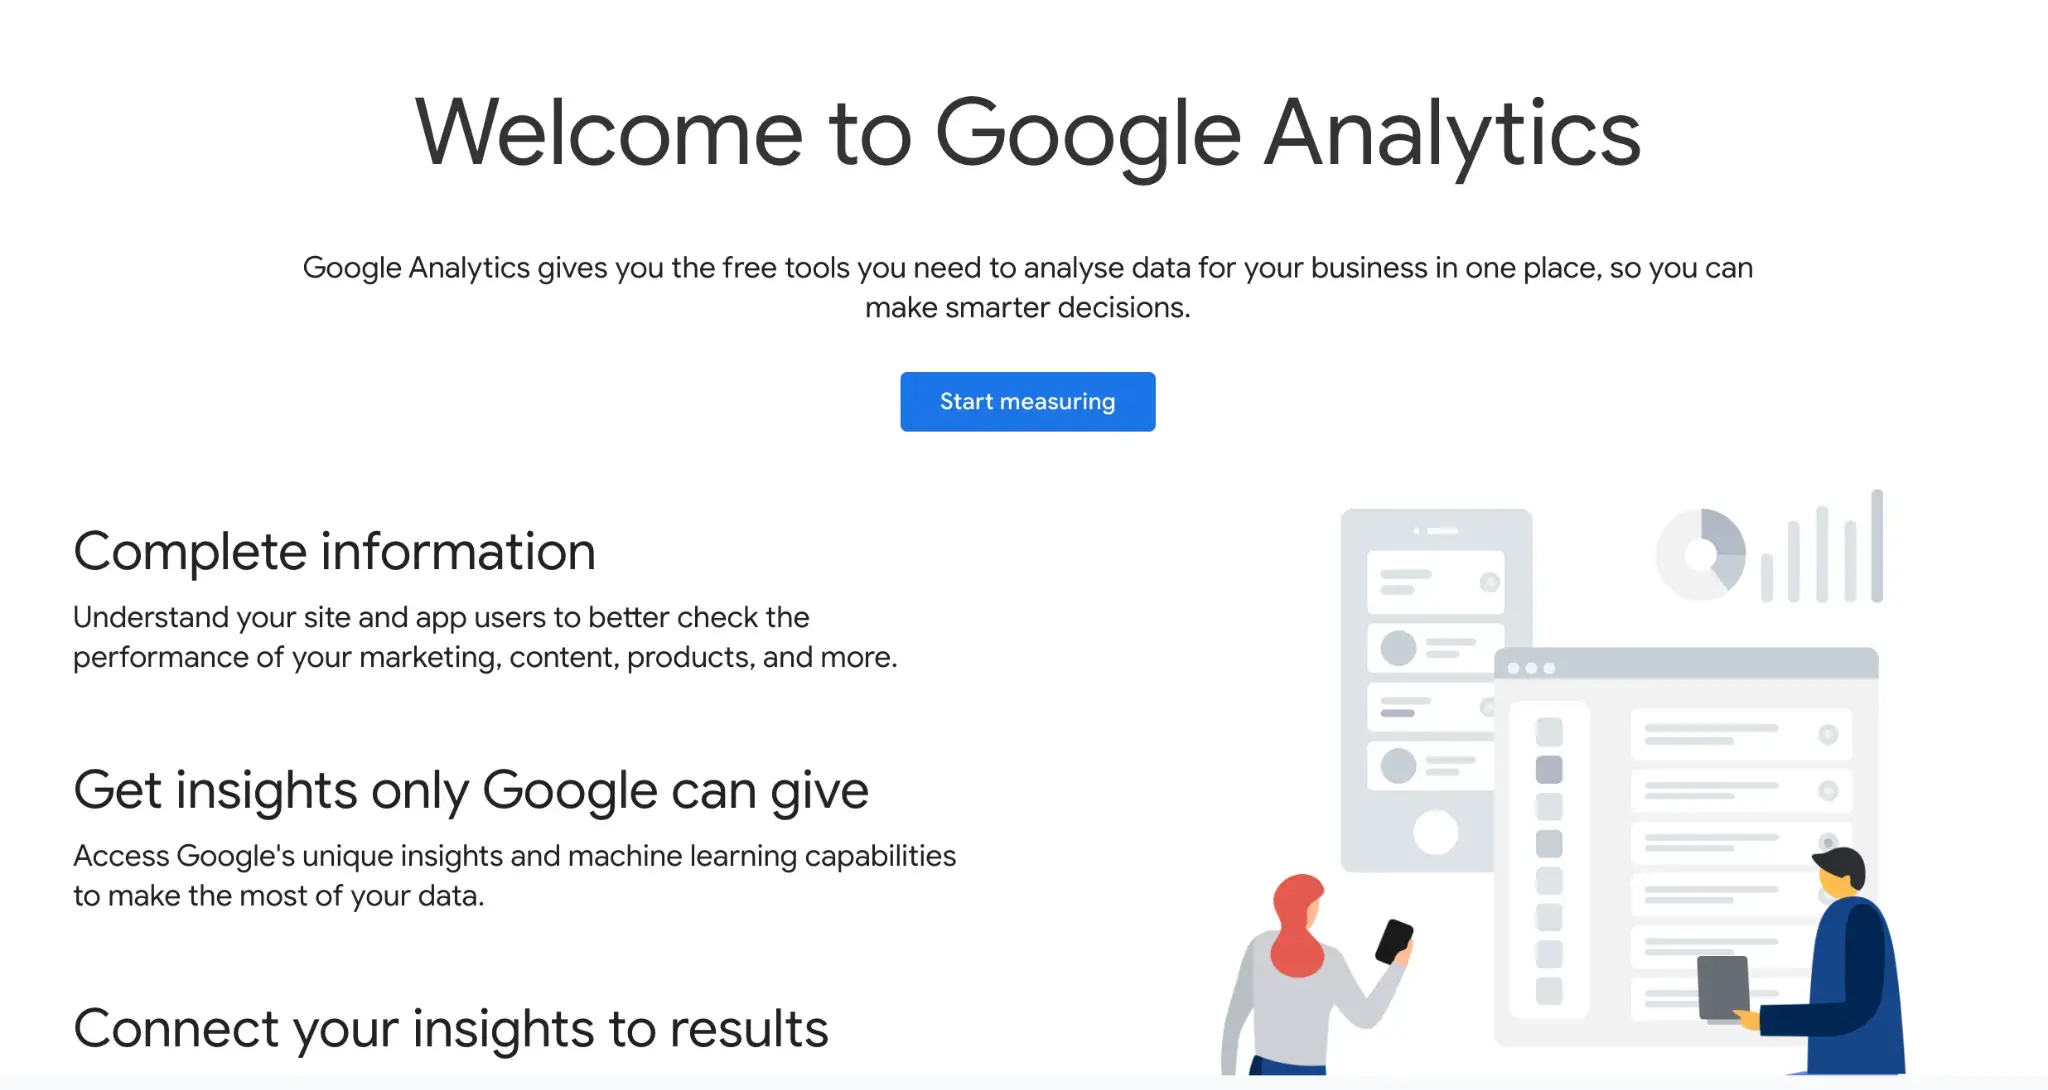
Price: Free, with a paid enterprise version available
Best for: Businesses of all sizes looking to understand the impact of their social media efforts on website traffic and conversions
Google Analytics 4 (GA4) plays a crucial role in understanding how social media efforts translate into website traffic, user behavior, and conversions.
It's the latest iteration of Google's web analytics platform, designed with a focus on cross-platform tracking and user-centric measurement.
For social media analytics specifically, GA4 offers several key benefits:
GA4 uses data-driven attribution models to help you understand how your social media channels contribute to conversions.
It can track user journeys that start on social media and continue across your website and mobile apps.
The platform provides detailed reports on which social media platforms are driving traffic to your site.
You can also set up custom events to track specific actions users take after arriving from social media, such as signing up for a newsletter or watching a product video.
Remember, GA4 alone isn’t enough to understand your social media performance as it doesn’t tap into social media engagement and other metrics. But it’s essential to understand the impact of social media traffic on your business.
Key features for social media analytics:
Social media acquisition reporting
Data-driven attribution modeling
Custom event and conversion tracking
Audience segmentation based on traffic source
Integration with Google Ads for remarketing
Make sense of your social media performance
Social media analytics are essential for achieving tangible results from your social media efforts. They ensure that every post and every dollar counts.
How can you set them up effectively?
Start by listing specific goals and metrics.
Then, choose a platform that meets your needs, create standardized procedures for creating social media reports, and adjust your strategy based on the insights you gather.
Are you ready to give it a try?
Talkwalker covers all social media reports in one place, making the whole process a breeze.