
Trend insights
How to track and forecast social media trends in 2026
Stay ahead of social media trends in 2026. Learn how to spot early signals, track trend velocity, and forecast what’s next before trends peak.
January 19, 2026
Knowing how to stay updated with social media trends is critical in 2026. Trends are accelerating as brands react to viral moments in real time. To keep up, social media managers must know which signals to watch so they can spot emerging trends before they peak (and fade).
Key takeaways
1. Trend success in 2026 requires agility
Social media trends now spike and fall at breakneck speed. To stay relevant, brands must catch the trend while it’s still rising. This may require a response within a few hours of a trend emerging.
2. Automated trend tracking and prediction is essential
Small signals can foreshadow big trends. With the right tracking tools, your social team can spot these shifts early. This buys critical time to create relevant content that speaks to your audience. This, in turn, creates more timely posts and better opportunities for virality.
3. Trend forecasting supports smarter long-term content planning
Researching social media trends is not all about short-term or viral moments. Understanding longer-term trends and cultural shifts keeps evergreen content fresh and relevant, too.
Why does staying ahead of social media trends matter in 2026?
Staying ahead of the latest social media trends matters in 2026 because brands are expected to react within hours, rather than days.
Get on board as the trend is still rising, and you’ll harness cultural cachet with an algorithmic boost. Trying to catch a trend that’s past its peak, though, can make you look out of touch with the culture of the moment.
How do trends influence brand relevance and audience engagement?
Social trends directly influence brand relevance and audience engagement. They have become cultural touchpoints. They provide a shared vocabulary. They signal affinity: A brand that understands a trend I enjoy might be worth checking out.
Brand content that thoughtfully plays with a trend can earn attention and engagement. It feels like it belongs in the feed right now. This signals relevance, especially to younger audiences.
Why is trend velocity increasing? (And what that means for marketers)
Trend velocity is increasing in part because of algorithm changes. Social platforms now amplify similar content themes based on micro-behaviors. Add in the use of AI for content creation and faster feedback loops from an always-on audience, and trends no longer grow slowly. Instead, they seem to emerge fully formed – no one is doing it, and then everyone is.
Trends in the real world tend to follow a bell curve pattern, with a clear rise, peak, and fall. But on social media, bell curves have been replaced by spikes and dives. A trend might peak and become stale within a few days, then lie dormant for a while before picking up again.
Consider the conversation around Taylor Swift’s announcement and launch of The Life of a Showgirl.
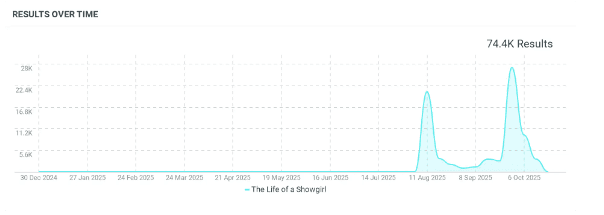
Mentions of The Life of a Showgirl over time, January 1, 2025, to October 20, 2025, 1% sample; source: Talkwalker Social Listening
Announcement week saw 2.08 million mentions, and launch week saw 2.71 million mentions. In between, the conversation petered out. Brands embraced the album aesthetic at both key moments. But they would have looked out of place trying to catch the trend on the downward curve.
August 12, announcement day, saw brands race to post simple graphics inspired by the album art:
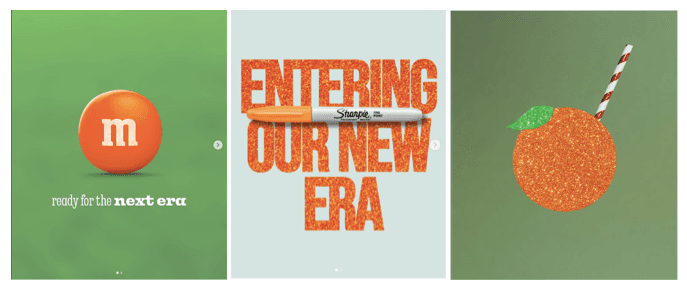
Sources: @mmschocoate, @sharpie, @tropicana_juices
By launch day, October 3, brands had time to prepare more elaborate posts:
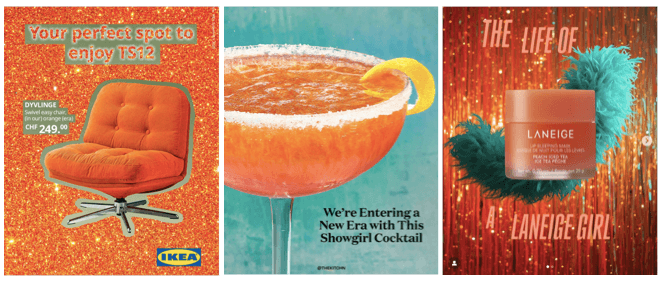
Sources: @ikeaswitzerland, @thekitchn, @laneige_us
This means that readiness matters as much as planning for social media marketing. Identify signals early. Create content on the fly (even if it’s basic). Then prepare for a more elaborate response if a trend has legs. Keep an eye on trend signals and be ready to interrupt the content calendar at any time.
What does “trend tracking” really mean today?
Trend tracking is a broad concept. It includes three distinct social media management tactics:
Trend monitoring
Trend tracking
Trend forecasting
Trend monitoring vs. tracking vs. forecasting
Each of these serves its own purpose in understanding and responding to social trends and cultural shifts.
Approach | Focus | Timeframe | Strategic value | Key activities |
Monitoring | Real-time trend awareness | Immediate | Rapid response and crisis management | Set up topic & keyword alerts Monitor trending hashtags & keywords |
Tracking | Historical analysis and benchmarking | Past and present | Benchmarking and reporting | Analyze mentions, engagement, and sentiment related to the trend |
Forecasting | Trend prediction insights | Future | Proactive planning and strategy | Model trend trajectories Plan content for appropriate moments |
What are the key signals to watch across platforms?
Social media trends typically progress through five distinct stages. Each has its own key signals to watch across the social media platforms most relevant to your target audience.
Fanbase formation. Signals: Low volume of mentions with high sentiment. People who spark the trend are fans and early adopters
Catalyst(s). Signals: Sudden spikes in conversations. See August 12 and October 3 in the Taylor Swift example above.
Virtuous circle. Signals: Consistent growth in mentions. The trend grows organically.
Backlash. Signals: Drop in net sentiment. The trend is overdone or has reached audiences that don’t like it.
Status quo. Signals: Conversation reaches a stable baseline or fades away, until the next catalyst drives a resurgence.
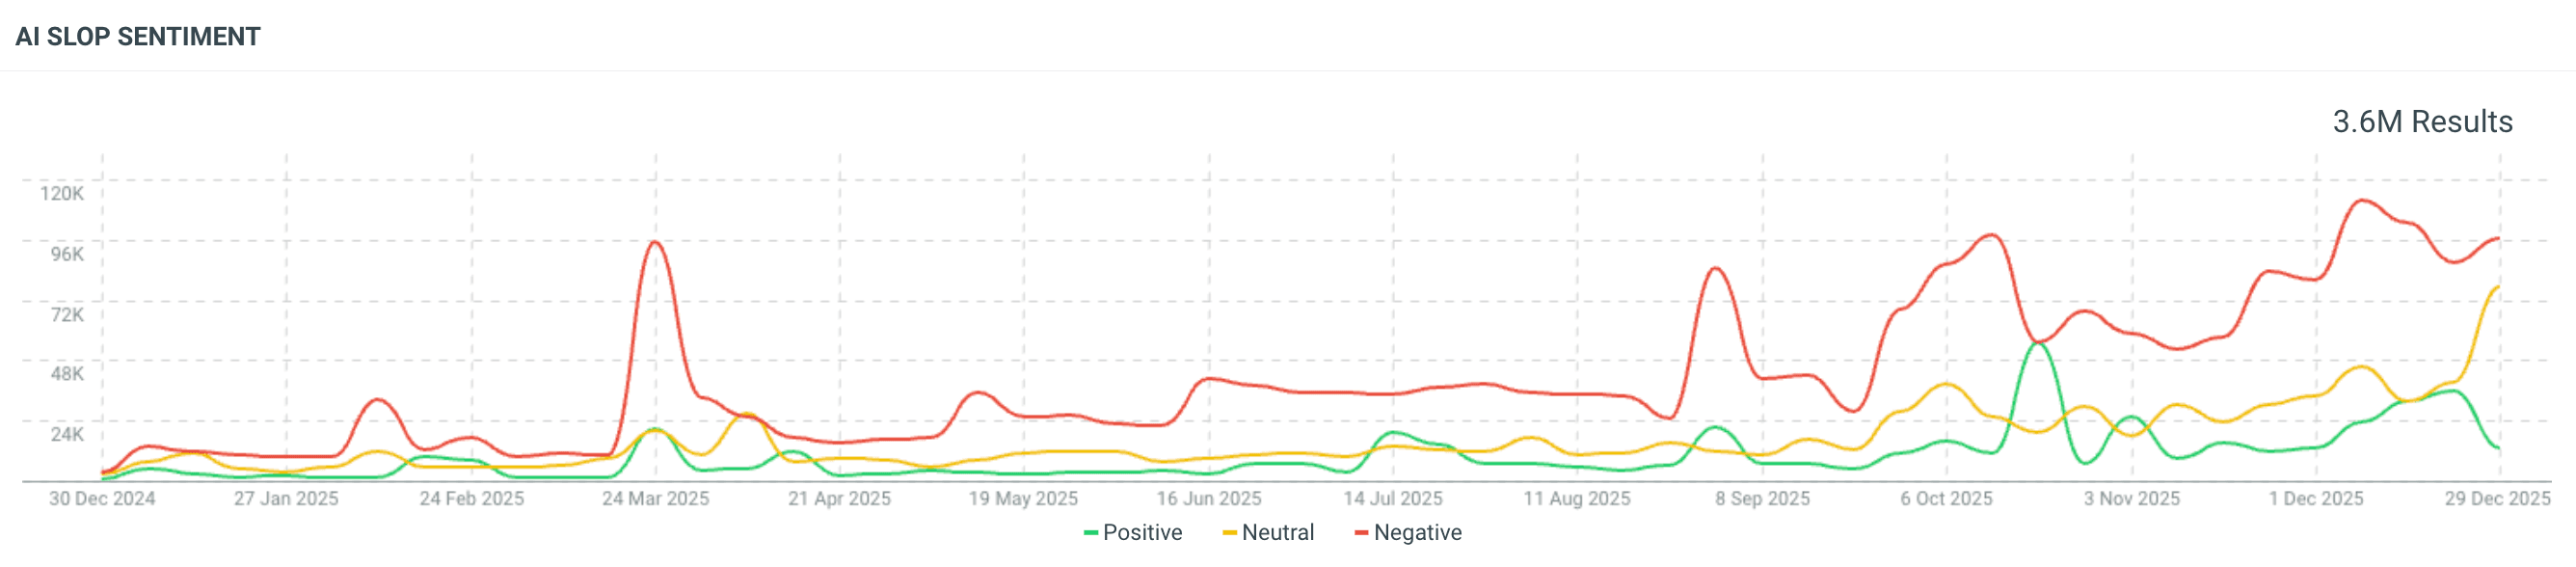
In 2025, we used Talkwalker Social Listening data to analyze mentions and sentiment patterns for the recent Labubu craze.
Here’s the pattern in mentions. The two early spikes represent catalyst events related to influencer and celebrity call-outs. These were mainly in the Asian market. Catalyst 3 pushed Labubus into the global cultural mainstream in April 2025.
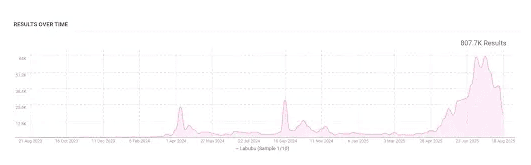
Mentions of Labubu, August 2023 to August 2025), 10% sample; source: Talkwalker Social Listening
How to stay updated with social media trends: 5 best practices
Sure, an active digital marketing team will get some sense of what’s trending simply by scrolling their feeds. But the most effective social teams understand how to research social media trends proactively. With these best practices, you can create a trend intelligence system to surface meaningful signals. This can give you the jump on the competition.
1. Build a listening framework
A social listening framework provides structure and agility to your trend-tracking. Here’s a simple three-step framework:
Define your goals. Are you looking for specific content formats and memes? Or overall conversation themes and sentiment shifts? Also, define which platforms are most relevant.
Set up social listening tools. Use a tool like Talkwalker to set up comprehensive trend monitoring queries and alerts based on your goals. Include text, image, and video recognition for comprehensive results. And use sentiment and emotion to get a better understanding of each trend.
Analyze and act on your data. Put your insights to work to create trending content and join emerging conversations.
2. Combine qualitative and quantitative trend indicators
You saw earlier that trend signals rely on both sentiment and mentions. These are the most obvious qualitative and quantitative trend indicators, respectively. But they’re not alone.
Quantitative indicators are numeric data points that track the growth of a trend.
Qualitative indicators are descriptive and interpretive insights. They provide context, so you can get a sense of whether a trend is appropriate for your brand.
Quantitative indicators (Numbers/metrics) | Qualitative indicators (Vibes) |
Mention volume (of a keyword, hashtag or topic) Engagement volume Reach and impressions Growth rate | Tone (track through sentiment and emotion analysis) Key themes and topics Key voices (who is talking about this trend) Types of content (short-form video, meme, etc.) Conversation clusters |
3. Identify rising, peaking, and declining trends early
Timing is everything. 22% of marketers feel pressure to respond to trending topics or viral moments daily.
You want to catch a trend while it’s still in the catalyst or virtuous circle stages, before things peak. That can happen fast. Your feed was probably saturated with cuts to John Hamm dancing in mid-December 2025. But the trend started to fizzle by month’s end.
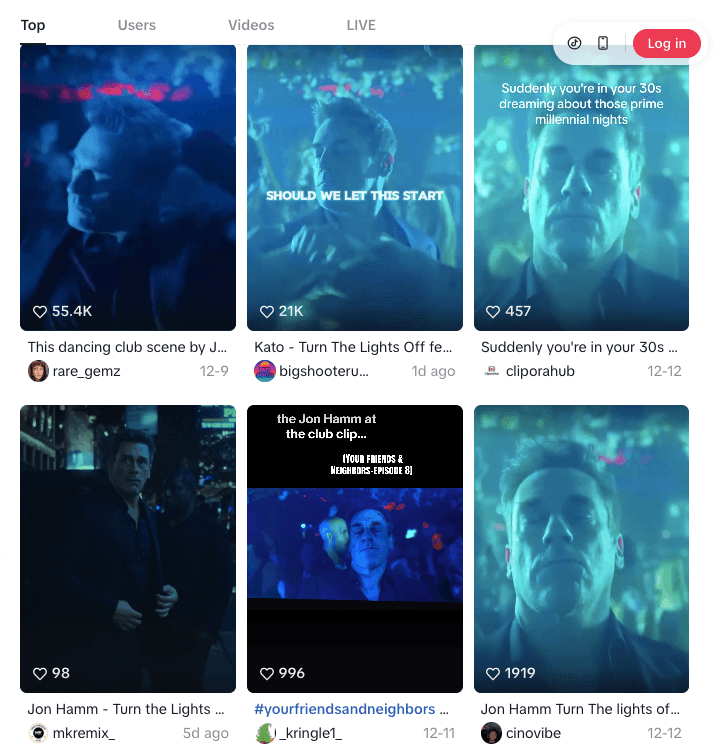
Source: TikTok
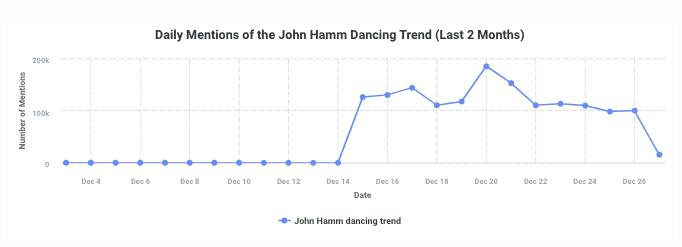
Source: Talkwalker Yeti Agent
Talkwalker’s growth rate and velocity indicators help you understand how a trend is growing: rapid upward movement is a clue to get on board fast. Volume and engagement alerts can let you know when the trend drops below a certain level, signalling it’s too late.
4. Validate trends with cross-platform analysis
What’s trending on TikTok may not be trending on Instagram (or, at least, not yet). Cross-platform validation helps you distinguish a fleeting or ultra-niche blip from a broader cultural moment.
Seeing the full picture also helps you understand how people’s feelings about a trend vary in different online communities. This is critical to understanding whether a trend is appropriate for your brand.
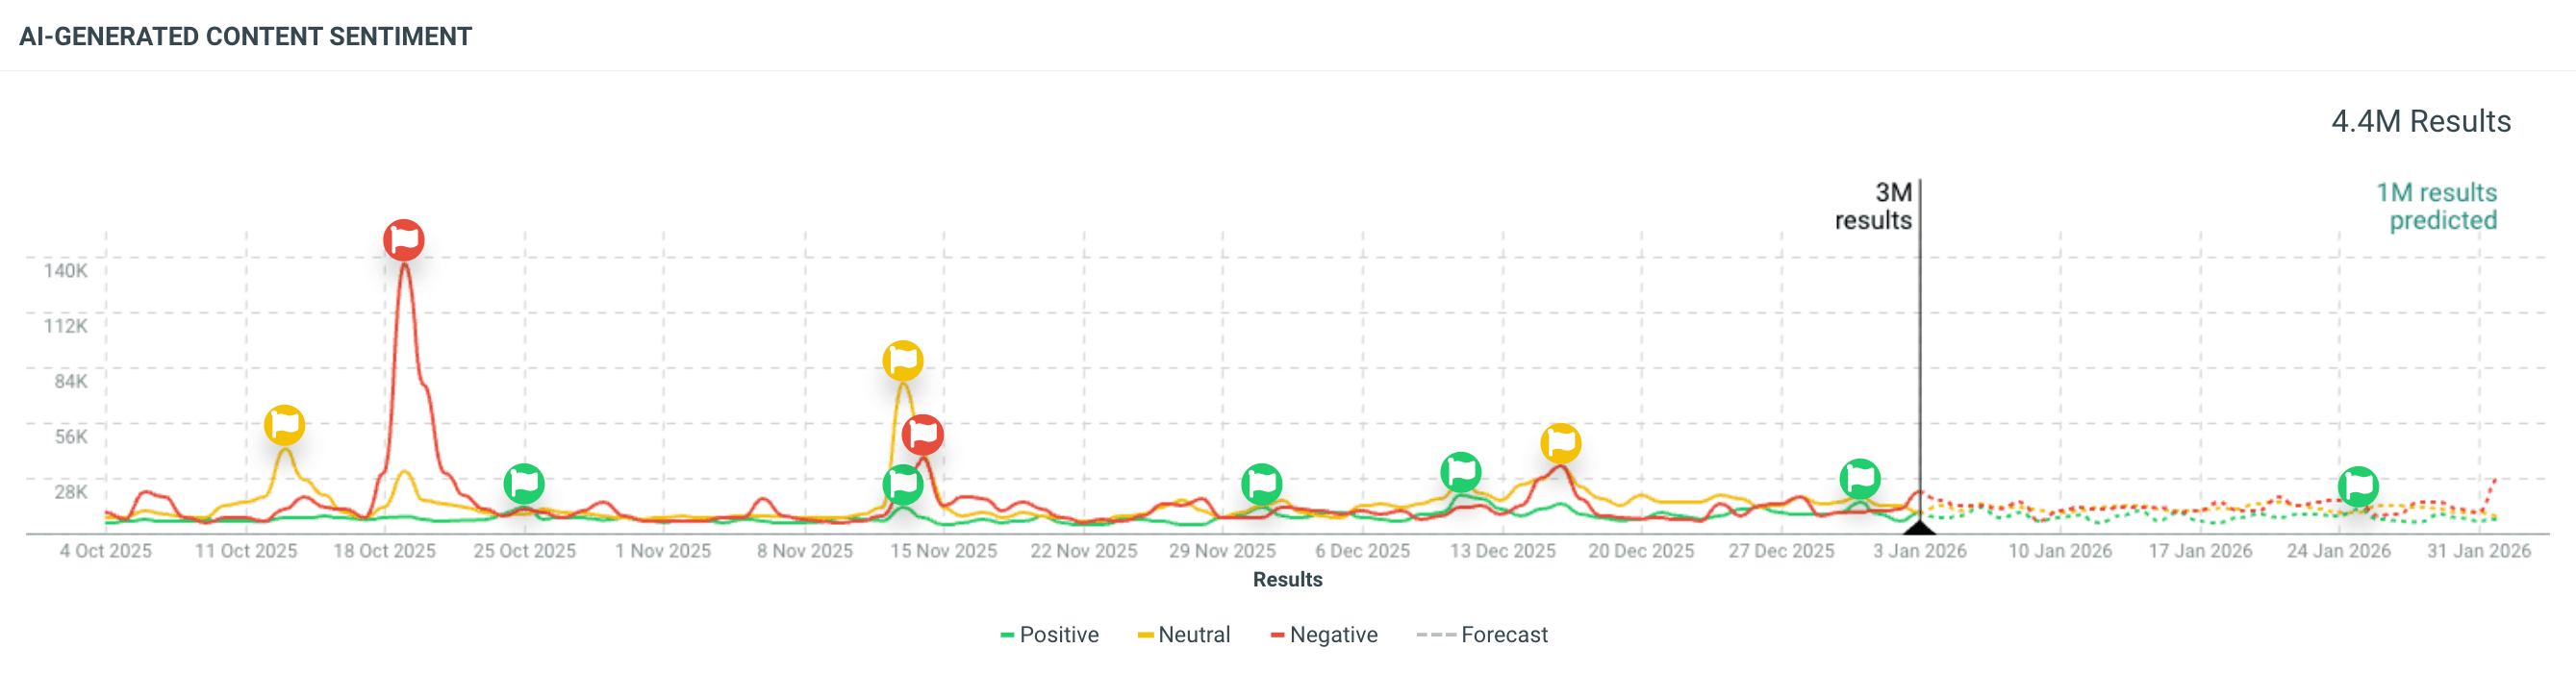
For example, look at the online conversation about The Life of a Showgirl from announcement to shortly after launch. It was generally positive on social networks. But on Reddit and forums, the conversation skewed a little more negative.
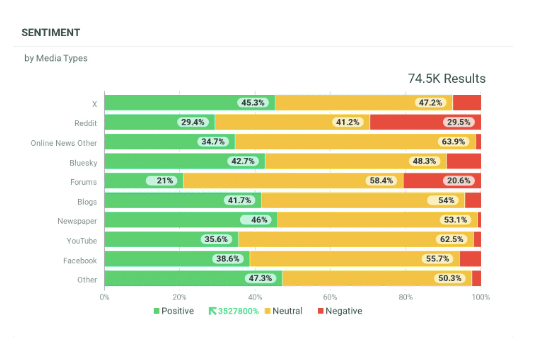
Mentions of The Life of a Showgirl, segmented by channel and sentiment, sample 1%, August 11, 2025, to October 20, 2025; source: Talkwalker Social Listening
5. Automate discovery to avoid manual blind spots
Humans alone can’t keep up with new trends at the speed they unfurl today. Automated trend discovery tools like alerts and social listening dashboards ensure you don't miss early signals.
AI-assisted tools like Talkwalker also help you avoid the blind spots that occur when searching for trends. (Think new slang, abbreviations, or unexpected topics.) They help surface new trends and memes before they saturate your audience’s feeds.
How can I use Talkwalker to track and forecast social media trends?
Set up Over Time Widgets to visualize and analyze trend evolution
Over Time Widgets are visual tools (like charts and tables) that show how data evolves over time – including predictions of future patterns. This makes them particularly useful for tracking trends. Especially with the built-in time-lapse replay.
Identify peaks, changepoints, and conversation dynamics
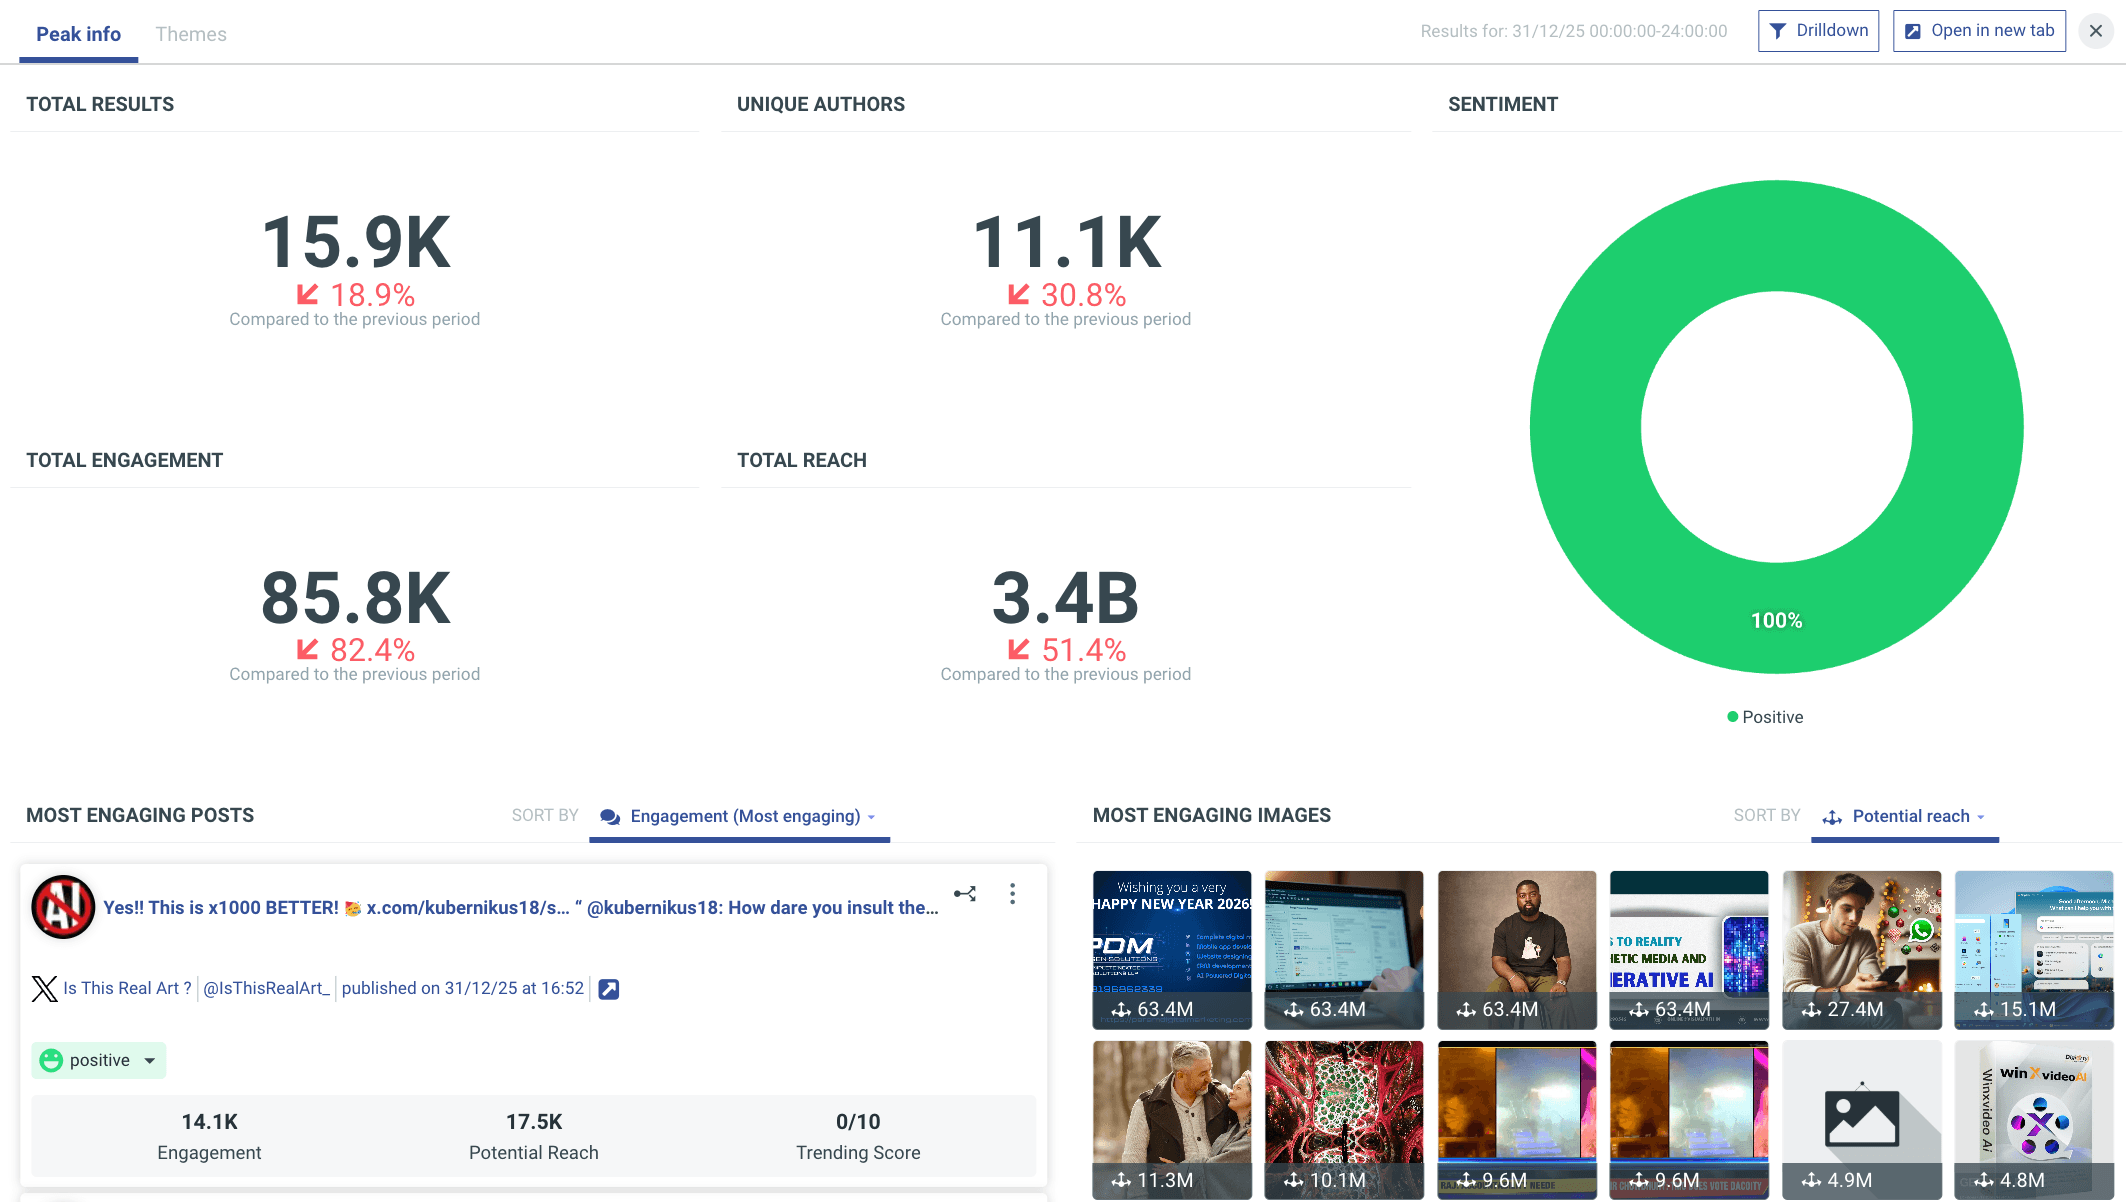
Over Time Widgets use AI-powered Peak Detection to flag significant spikes in data. These represent unusually high activity or interest in a topic or trend.
The Theme and Sentiment Over Time Widgets help show what’s driving the conversation, and the emotional connection to the trend. This ensures you know the full story behind a trend before deciding whether it’s appropriate and relevant. You can hover over each peak or changepoint to drill down into engagement and reach data, and even see a summary of relevant posts.
To set this up, head to your Talkwalker dashboard, choose the Over Time Widget you want to add, then select your data sources, metrics, and time period.
Customize Over Time Widgets for different strategic needs
You can customize Over Time Widgets to get the most valuable insights for your strategic trend tracking goals by adjusting:
Chart type: Line, bar, or area charts with color coding and annotations
Metrics: mentions, sentiment, engagement, topic/hashtag tracking
Geography
Time interval: Date ranges and granularity
Filters: Platform, geography, demographics
Comparative analysis: Overlay multiple trends to see how they intersect, or compare sentiment to volume
For instance, you can set the time period to months for long-term trend tracking that represents ongoing cultural shifts. Or, set it to days or even hours for in-the-moment trend analysis.
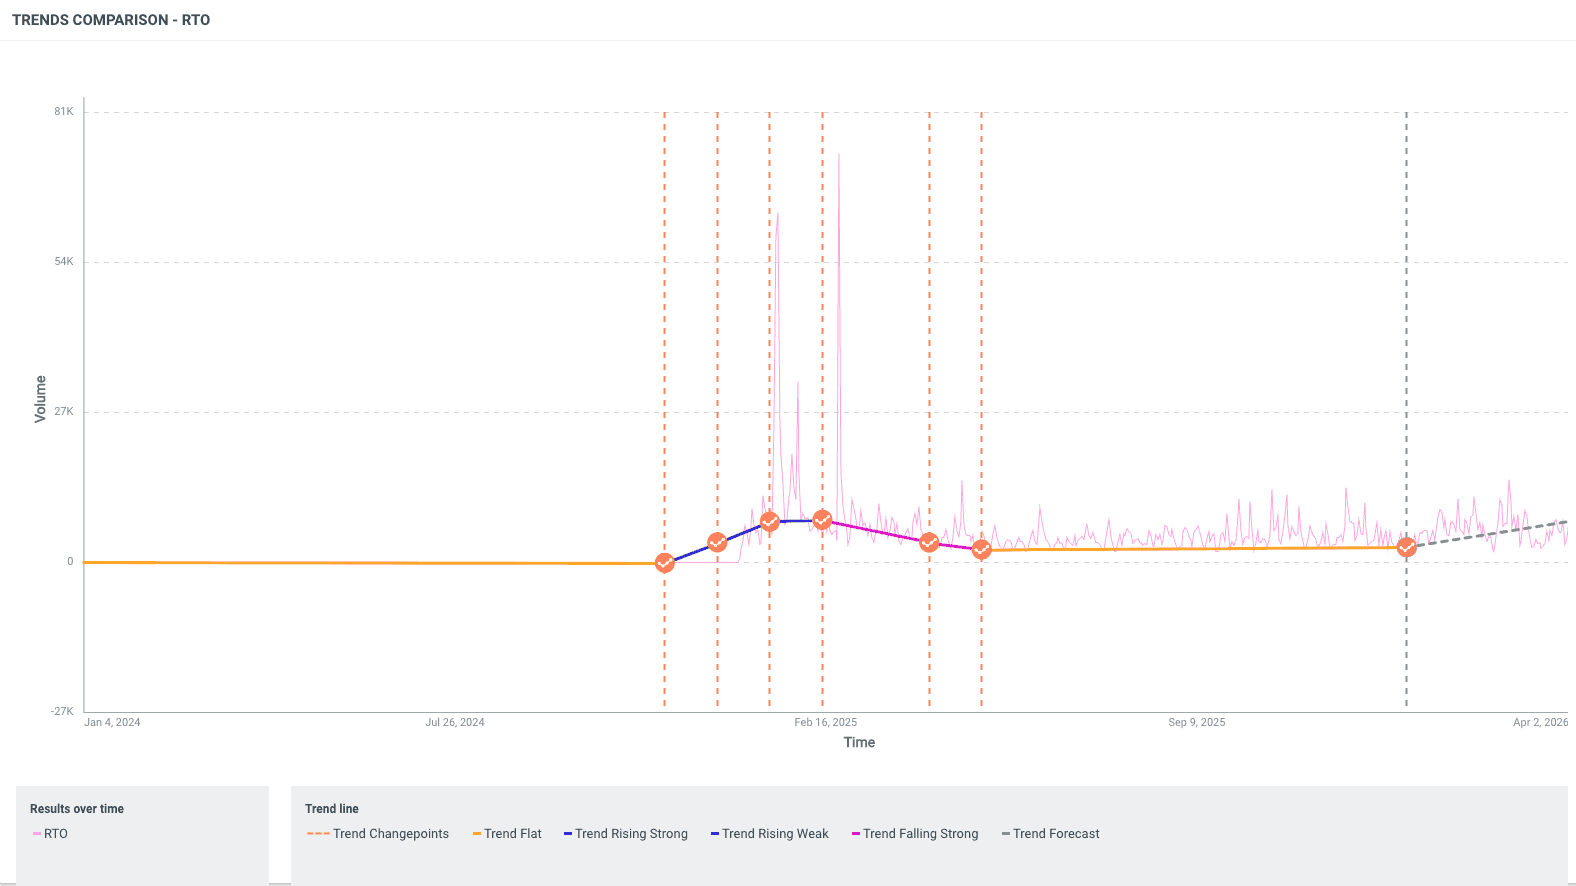
Use the Trend Analysis IQ App to understand rising, falling, and flat trends
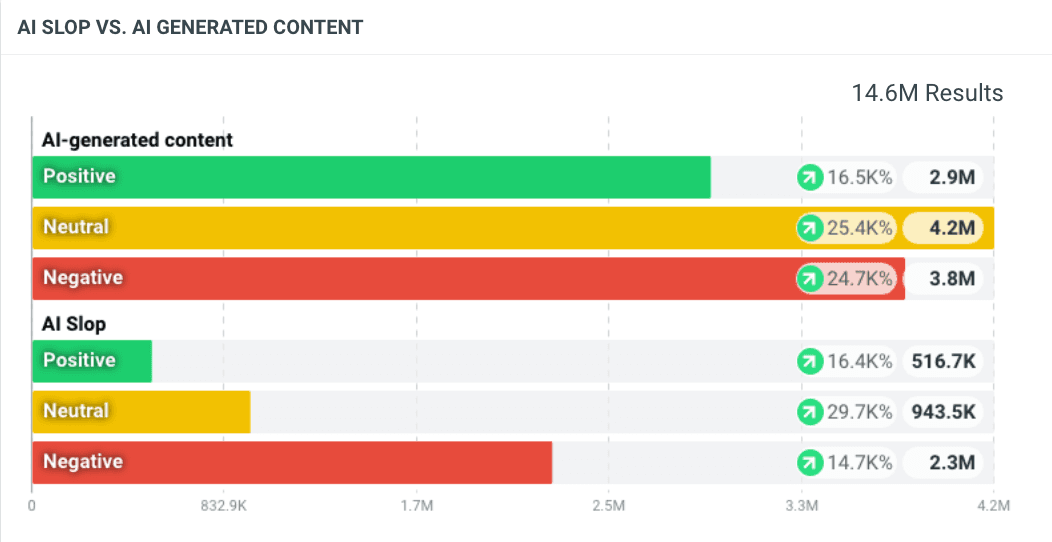
This Talkwalker feature scans large volumes of social data for automated trend detection. It can highlight topics, hashtags, or keywords using intuitive charts and graphs. It provides clear trendlines, so you can always see if a trend is rising, flat, or falling.
To set this up, head to the Trend Analysis IQ App from your Talkwalker dashboard. Then choose your platforms and time frame. Look for:
Rising trends: Indicated by significant upward movement. These signal emerging trends or viral moments.
Falling trends: Indicated by significant downward movement. Interest is waning.
Flat trends: Look for periods of stable activity. The trend does not have upward/viral momentum, but may present a good opportunity to create evergreen content.
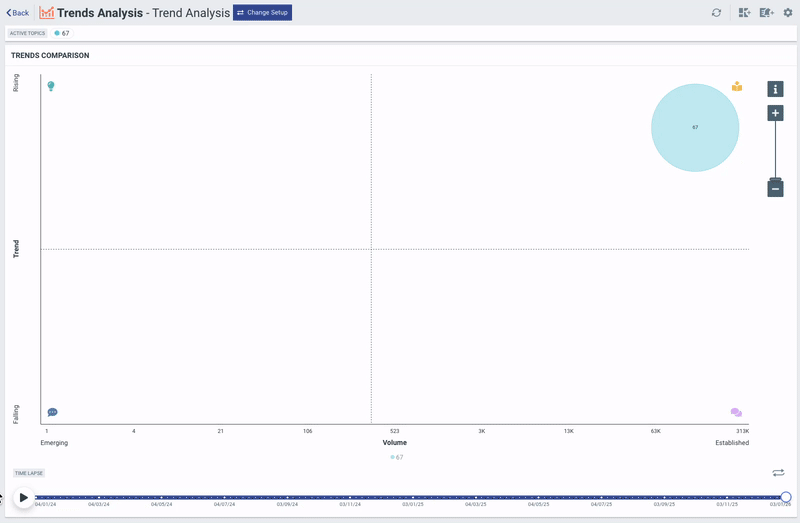
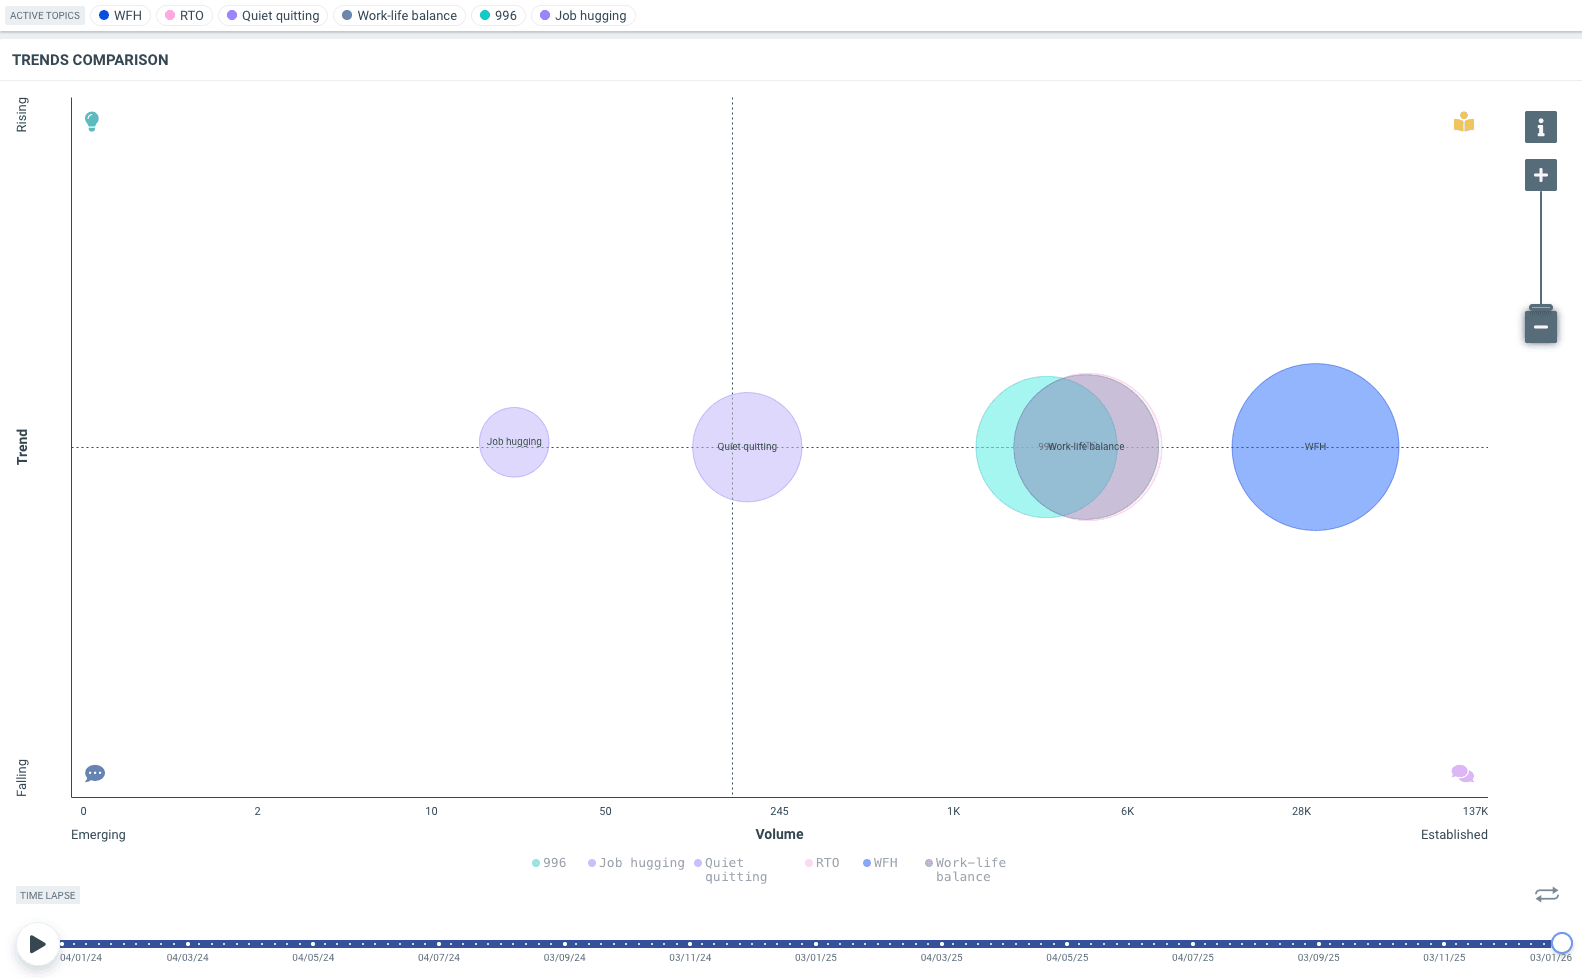
Use the Trend Matrix to distinguish emerging vs. established topics
The Trend Matrix takes a different approach to trend analysis. Rather than showing the latest trend’s growth over time, it provides a snapshot of the trend right now, divided into four quadrants:
High Volume, High Growth: These are emerging/viral topics ideal for short-term amplification.
High Volume, Low Growth: These established but stable topics are good for ongoing engagement.
Low Volume, High Growth: These are emerging or niche trends with potential to go viral. Consider joining in before the trend reaches the mainstream.
Low Volume, Low Growth: These topics are not trending.
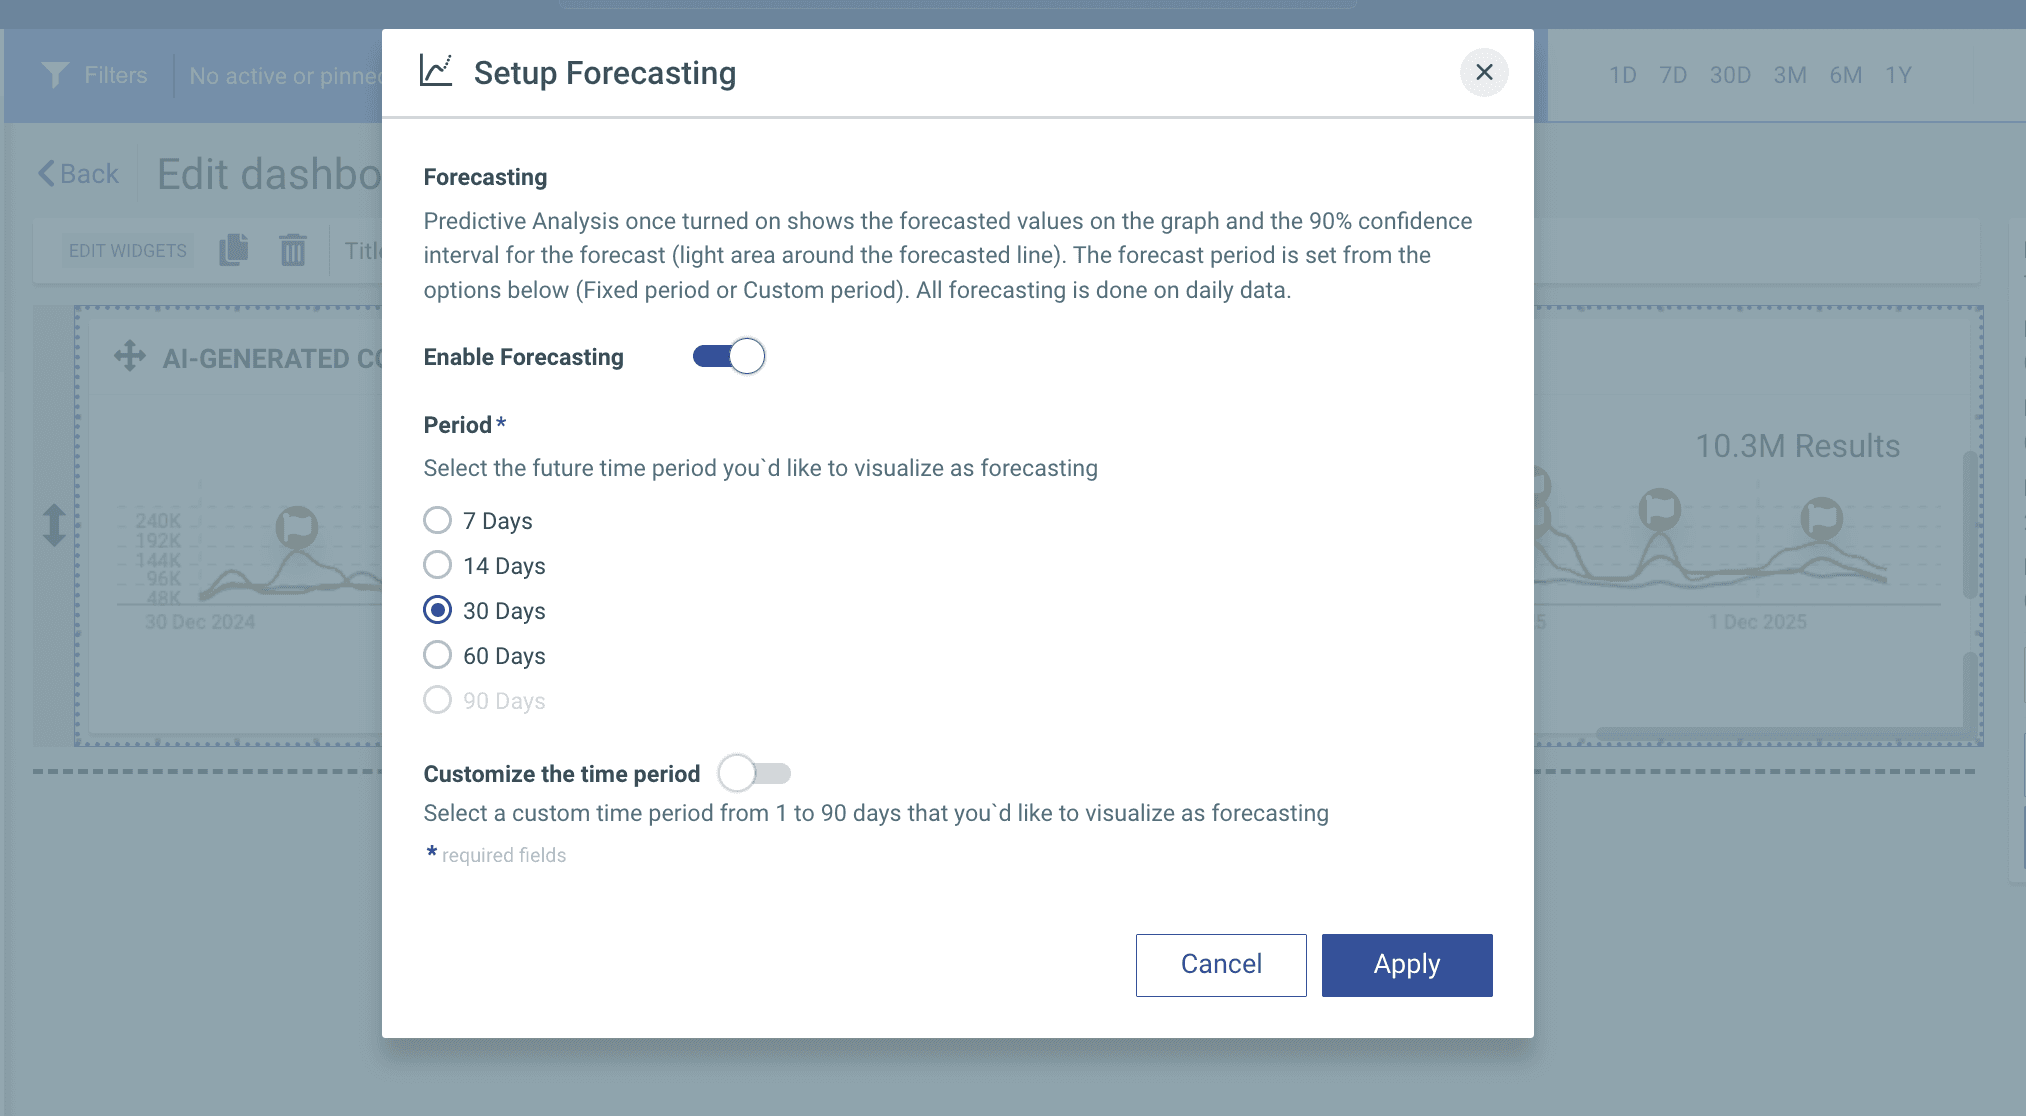
What Talkwalker’s Predictive Analytics can forecast (and how it works)
The AI-driven models in Talkwalker’s Predictive Analytics can predict future trends, conversations, sentiment shifts, and engagement for any topic or channel. It uses AI, machine learning, and data mining to create a 90-day forecast with a 90% confidence level.
Here’s a quick summary of how it works.
Data collection. Aggregates data from social media platforms, news sites, blogs, forums, and your internal brand channels
Historical pattern analysis. Identifies recurring patterns, seasonality, and anomalies that may impact future trendlines
Modelling. Uses advanced algorithms to model relationships between variables. Then integrates real-time insights with historical signals to refine predictions
Once all of that happens in the background, the tool produces forecasts for key metrics. You'll also see visualizations that make the insights easy to interpret.
To set it up, click the widget's three-dots action button. Choose Forecasting in the Advanced Analytics section, then toggle Enable Forecasting on. Select the relevant period and click Apply.
FAQs
1. What is the best way to find social media trends?
The best way to find social media trends is to use a tool like Talkwalker to set up a social listening framework and analyze trends across platforms.
2. How can I tell if a trend is a good fit for my brand?
You can tell if a trend is a good fit for your brand by analyzing the topics, themes, emotions and sentiment connected to the trend using a tool like Talkwalker.
3. What metrics indicate a rising social media trend?
The most important metrics to indicate a rising social media trend are increasing volume and positive sentiment. At the very early stages of a trend, you will see low volume but high growth rate – this indicates a chance to join a trend early if it’s a good fit for your brand.
Want to catch trends before they peak — and avoid jumping in too late? Talkwalker helps you spot early signals, track trend velocity, and forecast what’s coming next, so you can act with confidence, not guesswork. Book a Talkwalker demo to see how real-time social listening and predictive insights help you move at the speed of culture.