


Access Actionable Social TV & Sports Insights
Whether it’s a short preview clip enticing the audience to tune into that night’s episode or a full recap of the previous night’s late night interview, social video content is a vital tool to reach and engage a program’s fan base.
Building upon our existing Facebook and Twitter syndicated video performance measurement, Talkwalker Social Content Ratings (SCR) has most recently launched YouTube measurement, because we recognize that holistic cross-platform video views is a key metric for gauging success.
Since December 2020, SCR has measured more than 260,000 videos sent to promote over 2,000 TV & streaming programs that have generated more than 6.4 billion same-day views across these three social publishers.
SCR’s comprehensive and best-in-class measurement methodology is built around three different tracking windows, so programmers can fully analyze and understand the different ways that audiences engage with and view social media content over time to optimize their strategies.
SCR’s linear measurement is...
- Powered by Nielsen Gracenote TV guide data
- The foundation of our system as linear TV is still the cornerstone of audience engagement for broadcast and cable programming
- Able to measure and report on social viewing activity that is aligned with the linear schedule where the greatest immediate engagement and viewing takes place
SCR also has around the clock same day measurement, which covers streamers’ original programming and the increasingly dynamic campaigns broadcasters use beyond primetime hours.
Beyond linear and same day measurements, it’s important to measure how people are viewing social content for days, and even weeks, after it's posted. Our extended measurement window tracks video content for up to 35 days to capture all of the long-tail and viral viewing behavior.
For the study below, we analyzed the average number of views per post sent during the last two weeks of January 2021. We covered 574 broadcast and national cable programs airing new/live episodes posting 30,000 videos, as well as 129 streaming original programs posting 1,600 videos.
Linear measurement insights
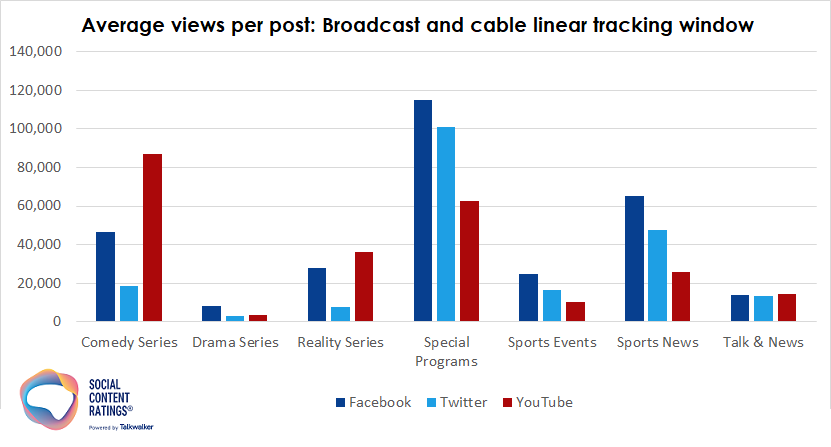
Within the linear window when a program is on air, we immediately see that the average performance differs by TV genres, indicating that certain program genres can optimize views on specific social platforms.

The average Facebook video related to a comedy series program generated 46K video views during the linear window.
The average Twitter video for a live special or a sports news program generates 13X or 6X more views in the linear window, respectively, than a Twitter video associated with other genres.
Additionally, we see that entertainment genres, especially comedy and reality, drive nearly 90% of their linear views on Facebook and YouTube, with comedies seeing even greater viewing on YouTube.
Insight: As the data demonstrates, network marketing teams should be cognizant of which platforms have the potential to drive the most views based on the genre of the promoted program.
Same day measurement insights
When the tracking window is expanded across the entire day, we see that same day viewing patterns are highly aligned with linear behavior. This is expected given the significant fan base engaging with program content while TV programs air.
For instance, social video content related to comedy and reality series aired on traditional broadcast and cable networks continue to generate a majority of views on Facebook and YouTube throughout the day.

The average Facebook video related to a comedy series program aired on a traditional broadcast or cable network generated 80K same day video views.
Interestingly...
- Social video consumption related to originals on streaming services vastly differs compared to genre counterparts aired on traditional broadcast and cable networks
- For original comedy series on streaming, we see a more balanced distribution of views across all three platforms, with Twitter performing the best on average
- For original drama series on streaming networks, we see that their video content across platforms generates close to 5.3X more views on average compared to video content related to broadcast and cable drama series programs
- Finally, for original reality series on streaming, Facebook plays a significant role in driving video views, generating 67% of total cross-platform views on average
Insight: Social video content from streaming programs does not follow the same genre patterns as linear based networks. As a result, streamers should consider more bespoke strategies rather than mirroring linear strategies.
Extended measurement insights
However, content doesn’t live online for only one day. Audiences may turn to social media the next morning -- or the next week -- to (re)watch that program's social breakdown, sometimes causing certain clips to go viral in the days after it’s posted.
For this reason, SCR also provides measurement through an extended window up to 35 days to better understand how video performance changes over time given this delayed video consumption.

The average Facebook video related to a comedy series aired on a traditional broadcast or cable network generated 59% of its total views (up to 35 days) after the day it was posted.
On average, Facebook and YouTube videos see a much larger share of views generated beyond the first day when posted compared to Twitter. Video performance over time is more a function of the platform, rather than the program genre.
Insight: Regardless of whether your content is in promotion of a broadcast, cable, or streaming program, marketers should expect significant increases in video views past the first day across all platforms with most significant increases in views on Facebook and YouTube.
To wrap things up...
As we’ve seen, the behavior of video content can vary across program genre, network type, and across time. SCR’s syndicated metrics provide visibility into all the different social video strategies used across the TV universe at both a high and low level.
From this, you can benchmark yourself against your competitors at a general genre level, and also examine specific examples of content performance in order to refine your social video strategies.
Methodology/Sourcing
Talkwalker Social Content Ratings TV data Facebook, Twitter, YouTube. Videos posted January 18 - 31, 2021. Measurement for 574 broadcast and national cable programs airing new/live episodes posting 30,000 videos, and 129 streaming original programs posting 1,600 videos.
- Linear measurement covers social video viewing activity within the +/-3 hours of episode airing.
- Same day measurement covers social video viewing activity within the entire 5A-5A broadcast day when the post was made.
- Extended measurement covers social video viewing activity for thirty-five (35) 5A-5A broadcast days, where day of posting is considered Day 1.
