
128 Must-Know Social Media Statistics for 2025
People spend over 14 billion hours on social media every day. Explore the key social media statistics for 2025 and build a data-driven strategy.
May 26, 2025

- TL;DR: Key trends for 2025
- Key social media statistics for 2025
- Social media usage statistics
- Social media demographic statistics
- Social media marketing statistics
- Social media advertising statistics
- Social media listening statistics
- AI social media statistics
- Instagram statistics
- Facebook marketing statistics
- TikTok statistics
- Threads statistics
- Twitter (X) social media statistics
- Reddit social media statistics
- LinkedIn statistics
- Pinterest social media statistics
- Bluesky statistics
- YouTube statistics
- Social media video statistics
- Influencer marketing statistics
- Social media buying behavior statistics
- FAQs
- What this means for you
Social media isn't slowing down in 2025.
What's changing is how users engage, where they spend time, and which strategies drive results.
This guide delivers the most relevant social media statistics for marketers, bloggers, and business owners.
It'll help you make strategic decisions around social platforms, content formats, and audience engagement tactics.
Let’s dive in.
TL;DR: Key trends for 2025
The age of saturation: Social is now a full-time attention economy.
People spend over 14 billion hours on social media daily. The typical user dedicates more than one full waking day each week to scrolling. Yet, average time per user has started to dip. This signals a shift toward more intentional usage rather than endless scrolling.
Every brand is a media brand, and AI is the intern.
AI has transformed content creation. Businesses using GenAI report significant time savings and better engagement from AI-assisted content. But users remain skeptical of AI in branded formats like podcasts and ads. Low-effort AI simply doesn't build genuine connections.
Virality is dead. Welcome to niche-scale influence.
Brands no longer chase viral moments. They focus on what works: resonant, community-first content for specific audiences. This micro-virality creates the perfect balance between trust and traction. Content performs better within targeted communities than with mass audiences.
Video is the new homepage.
Video dominates engagement on various social media platforms. TikTok, Reels, and Shorts shape how users discover brands and products. YouTube, TikTok, and Instagram now rival search engines for discovery. Video has evolved from a tactic into the default format for effective social content.
Multi-platform = default user behavior.
Users now juggle about 7 platforms every month. Top apps vary dramatically by age, intent, and region. Brands can't survive on just one channel anymore. Cross-platform presence has become essential for visibility and relevance.
Key social media statistics for 2025
The raw numbers tell a powerful story about social media in 2025.
People now spend over 14 billion hours on social media daily. That's more than one full waking day each week for the typical internet user.
The AI content revolution is delivering real results. 90% of businesses use generative AI report meaningful time savings, and 73% see tangible engagement rate lifts from AI-assisted content.
AI influencers are exploding, too. The virtual influencer market is projected to hit $37.8 billion by 2030, creating entirely new dimensions for brand connection.
For marketers, social listening has become a serious competitive advantage. Teams using these tools report up to double the confidence in their social media marketing ROI compared to those who don't. Particularly on platforms like Threads (30% vs. 16%) and Facebook (67% vs. 27%).
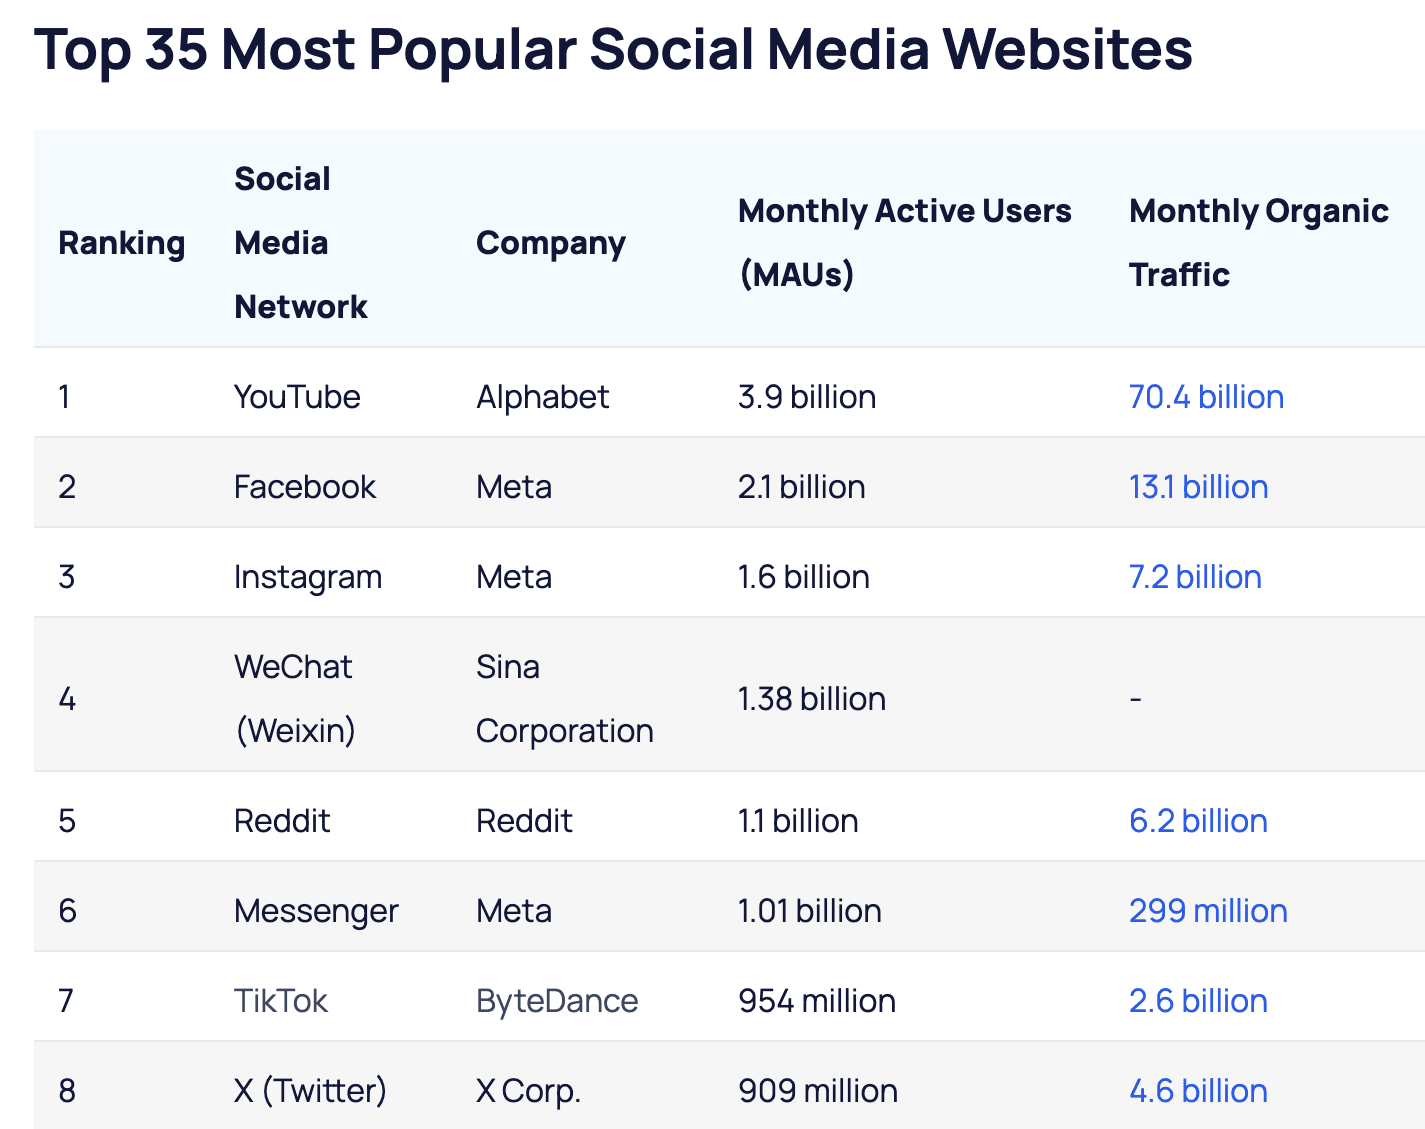
YouTube leads the pack for monthly active users and traffic, followed by Facebook, Instagram, WeChat, and Reddit. TikTok sits at 7th, X (formerly Twitter) at 8th, with LinkedIn at 21st, and Threads at 26th.
Social media usage statistics
6. Over 5.2 billion people now use social media worldwide, roughly 64% (or two-thirds) of the global population.
7. Growth in global social media users remains steady at 4.7% year-over-year as of April 2025. In real terms, that's roughly 72 million new users joining social networks every quarter and 8 people joining every second.
8. By 2028, experts project the global social media user base will exceed 6 billion.
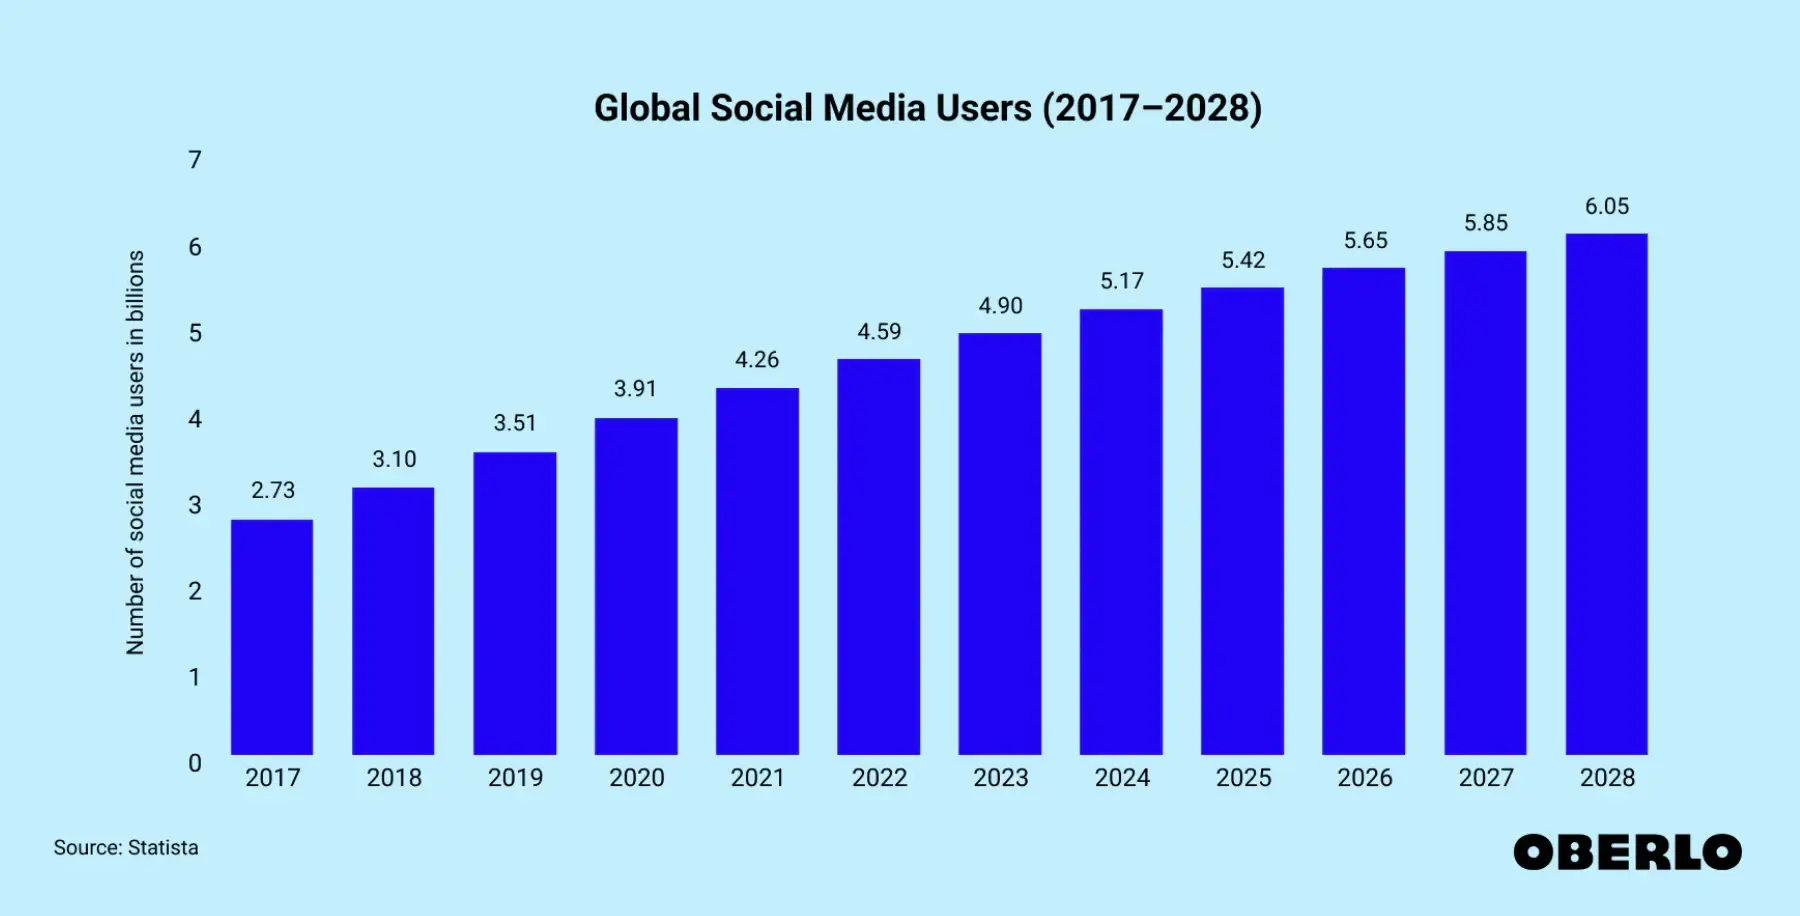
Source: Oberlo
9. The average time spent on social media varies dramatically by demographics. The average person spends 2 hours and 23 minutes daily on social activities. But Gen Z users spend three times longer on social apps than those 65+ years old.
10. Average time spent on social media dropped slightly (about 2 minutes) from last year. Growth rates have been slowing consistently since 2020, projected to fall from 6.75% in 2023 to 3.42% by 2028.
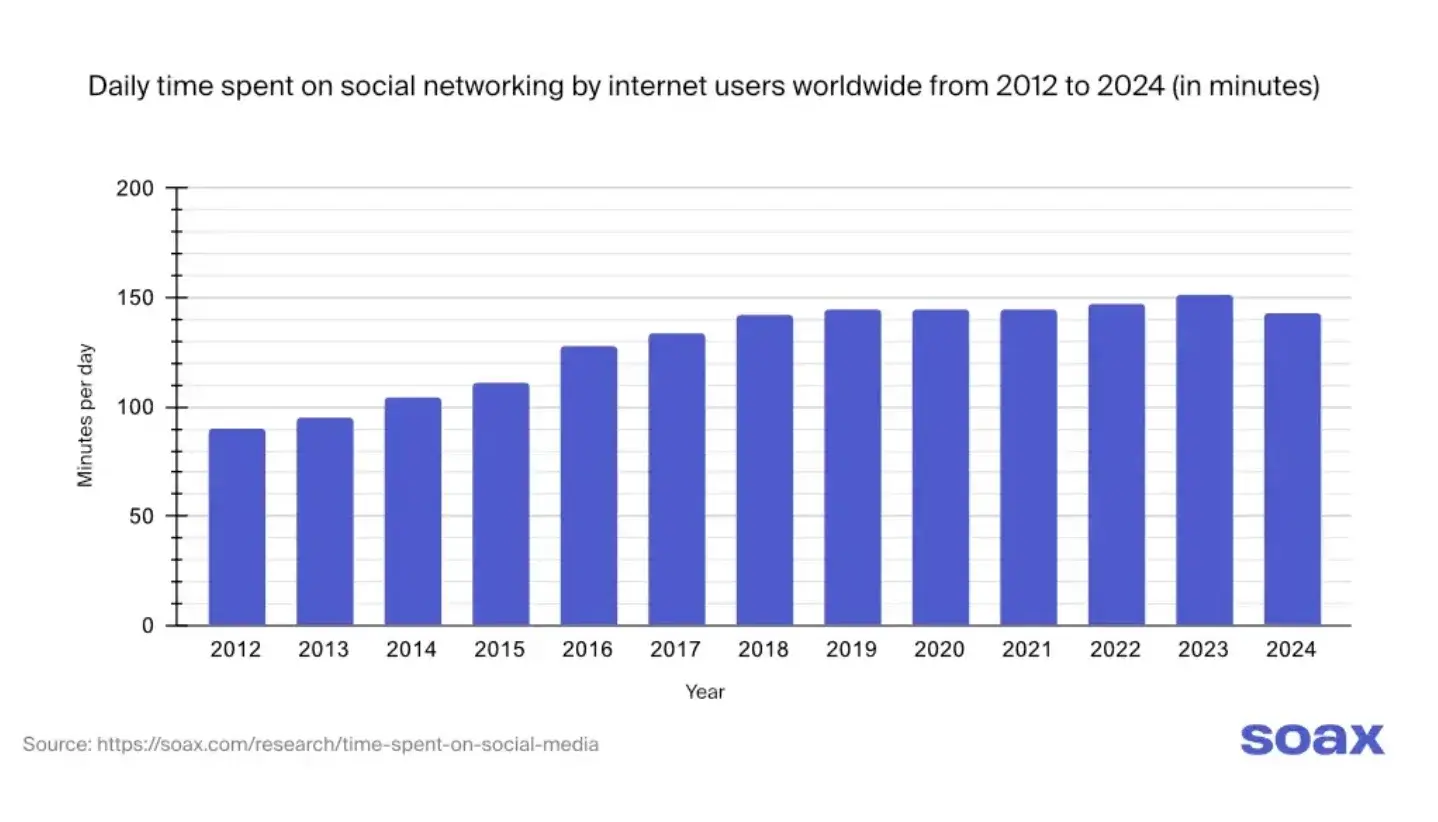
Source: Soax
11. Asia leads with nearly 3 billion social media users. The Americas follow with 819 million, Europe with 682 million, and Africa with 427 million.
12. Internet users now juggle an average of 6.8 different platforms monthly, creating complex cross-app behaviors that marketers need to understand to optimize their approach.
13. Despite jokes about Facebook being "for boomers," it still holds strong in the multi-platform landscape, slightly outpacing both TikTok (58.3%) and Instagram (56.9%) in usage metrics.
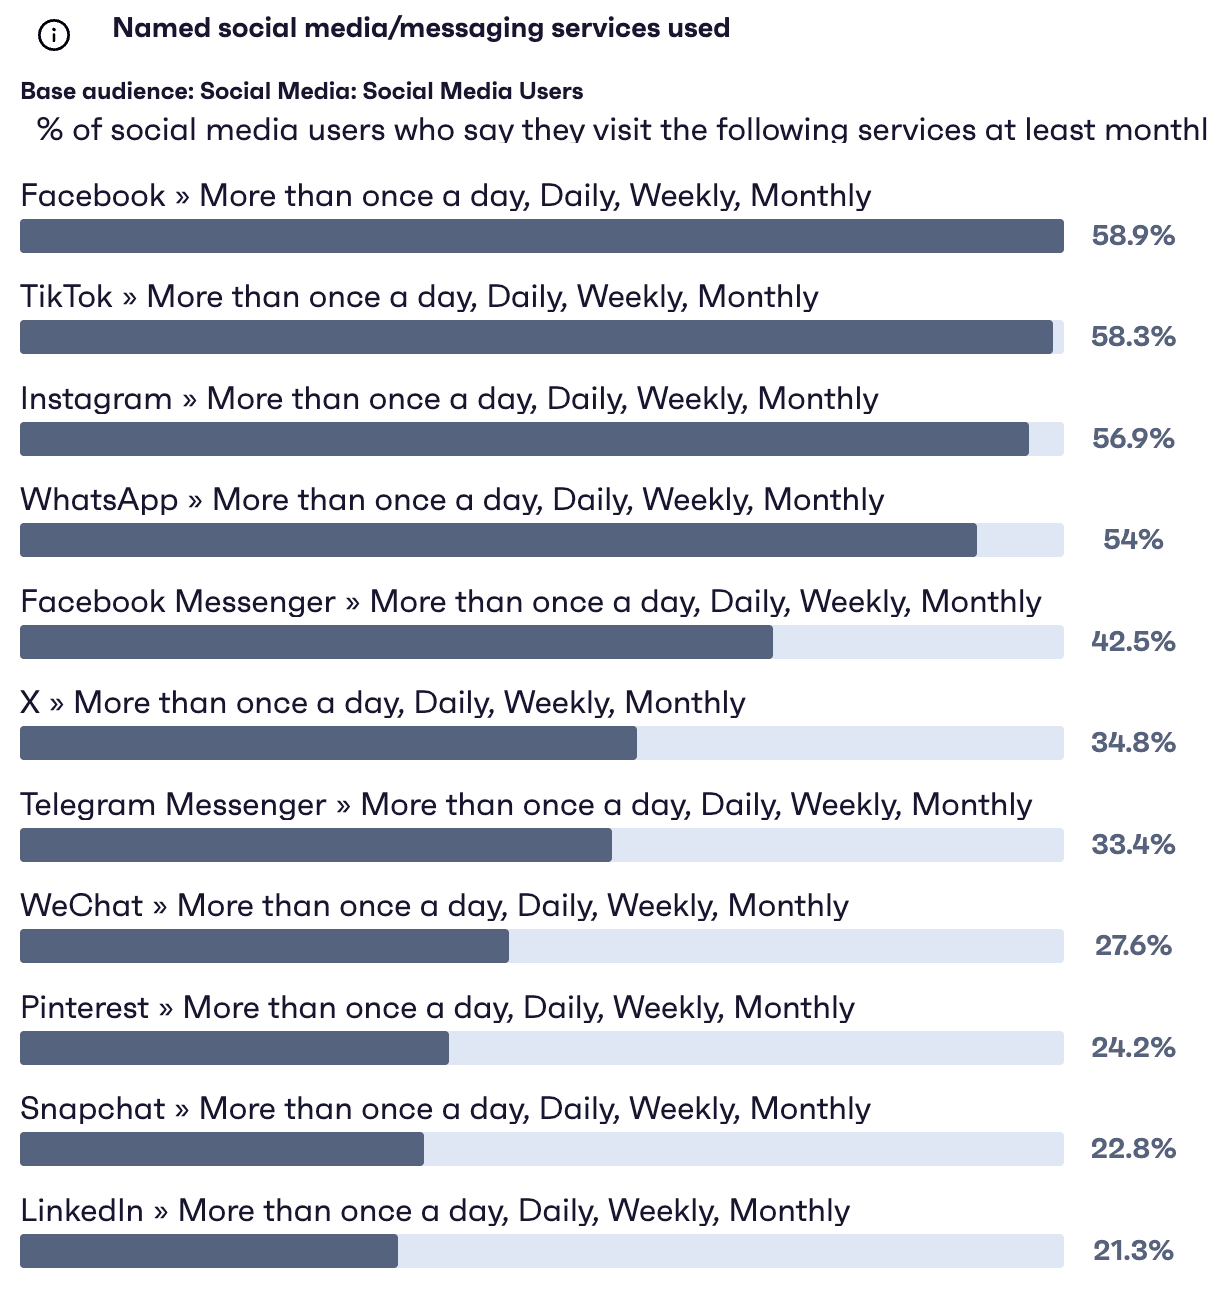
Source: GWI
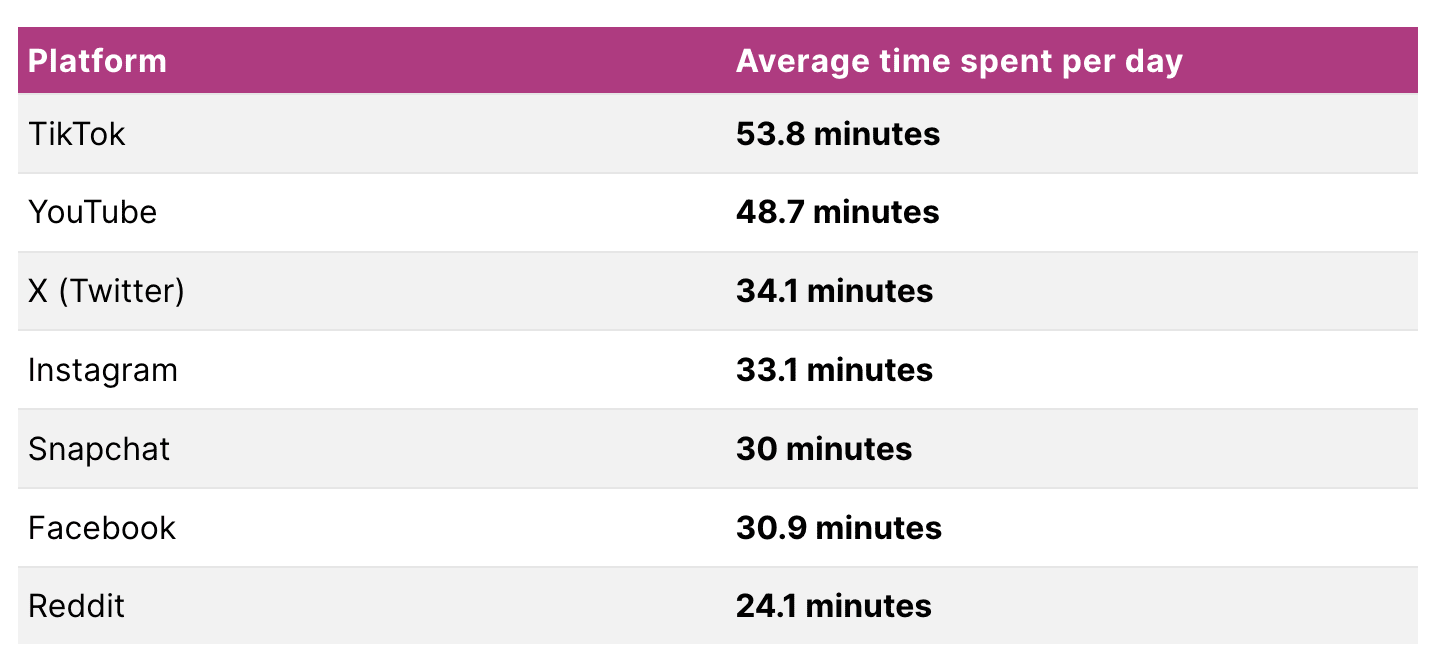
14. When examining daily active users and time allocation, TikTok leads with users spending 53.8 minutes per day on the platform. YouTube follows at 48.7 minutes, with X and Instagram tied around 34 minutes each. Snapchat and Facebook users spend about 30 minutes daily, while Reddit commands 24 minutes.
Source: Backlinko
Key takeaways:
Gen Z users spend over 3 hours/day on social media. This is nearly 3x more than users aged 65+.
Nobody's loyal to just one platform anymore: the average person actively uses 6.8 platforms monthly, creating complex engagement patterns brands must navigate.
Asia hosts over 57% of the global population of social media users, making it the epicenter of social media growth.
Social media demographic statistics
15. By 2027, there will be a combined 135.5 million Gen Z and millennial social network users in the US, representing over half of total US adults on social media.
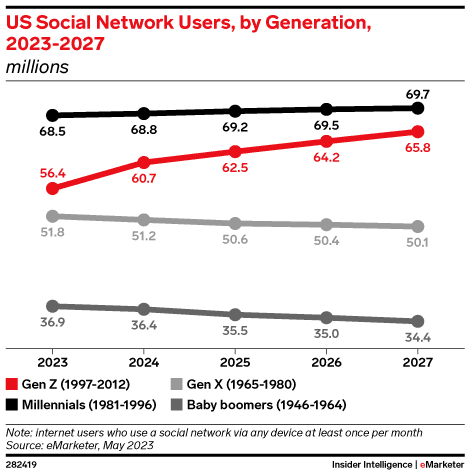
Source: Emarketer
16. Millennials remain the most active demographic on social, with roughly 69% using social media in 2025. They dominate on Reddit, where they represent about 40% of the user base. They also maintain strong presence on TikTok, though not as pronounced as Gen Z.
17. Platform preferences vary by age group. TikTok, Snapchat, and Instagram are the most popular platforms for Gen Z users. For Gen Z teens, Snapchat draws a higher share than Gen Z adults.
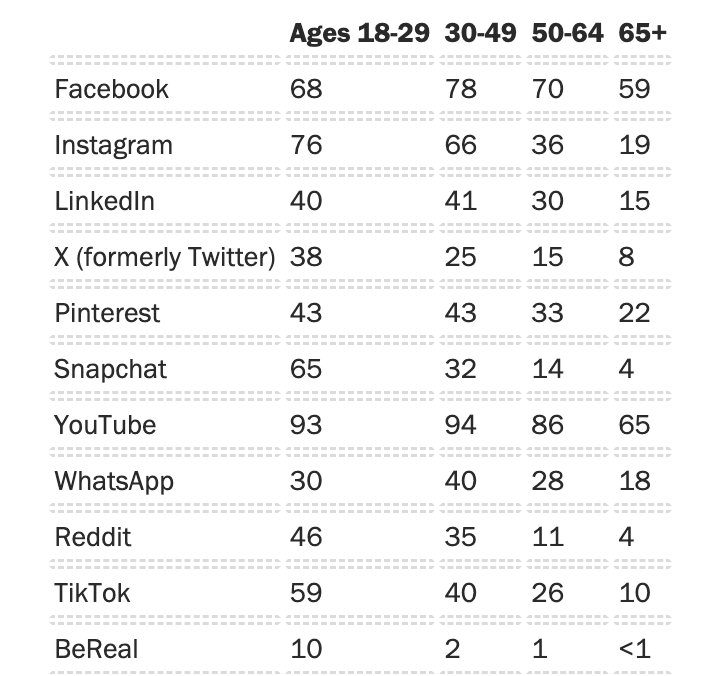
18. 67% of Gen Z prefers comedy and memes on short-form video platforms like TikTok. They also gravitate to video-centric and visual platforms: YouTube (78% of Gen Z uses it) is their top platform, followed by Instagram (76%) and TikTok (69%).
19. 42.9% of Gen Z rely on social media for daily news, with TikTok serving as the primary news source for 21% of users.
20. In fact, nearly 40% of Gen Z prefer searching TikTok or Instagram over Google when finding information, changing discovery behavior for this segment.
21. Gen X & Boomers prioritize Facebook and YouTube first, then Instagram, TikTok, and X (in that order) rounding out their top five. Boomers uniquely have Nextdoor in their top interests.
22. 77% of Gen Z (defined as ages 13-24) and 50% of Millennials follow social media influencers. The share of older generations following influencers is much lower: 24% Gen X & 17% Baby Boomers.
Key takeaways:
By 2027, Gen Z and Millennials will account for over half of all U.S. social media users, and their platform preferences will shape social media marketing strategy decisions.
Gen Z overwhelmingly prefers video-based and visual platforms like TikTok, YouTube, and Instagram. They also follow influencers much more compared to older generations who use social media to connect with people they know "in real life"
Boomers lean heavily toward Facebook and YouTube, while Millennials dominate Reddit and are slowly decreasing their presence on Facebook and X.
Social media marketing statistics
23. 90% of small businesses leverage social media in their marketing strategy.
24. Nearly 50% of businesses dedicate more than 60% of their social content to entertaining, educating, or informing without directly promoting products.
25. Quick responses drive significant engagement. Comments made within 1 hour of a post receive 257 engagements on average. Wait 24+ hours, and that number drops to 133-145 engagements.
26. Nano- and micro-influencers (1k–50k followers) respond to brand comments more often than larger accounts.
27. Brand awareness dominates social media marketing goals. 79% of marketers identify it as their top social media objective.
28. Over a quarter (27%) of social marketers actively adjust their content to align with trending topics and memes.
29. Social drives modest website traffic. Most businesses see 5-15% of their total site visits coming from social media channels.
30. Conversion rates from social referrals typically range from 2-5%, varying by platform and content type.
31. Successful social posts achieve engagement rates between 1-3% when driving referral traffic.
32. "Going viral" has lost its appeal. Public sentiment has shifted negatively toward viral content, with people expressing increased skepticism. Brands now target "micro-virality" within specific audiences rather than chasing mass reach.
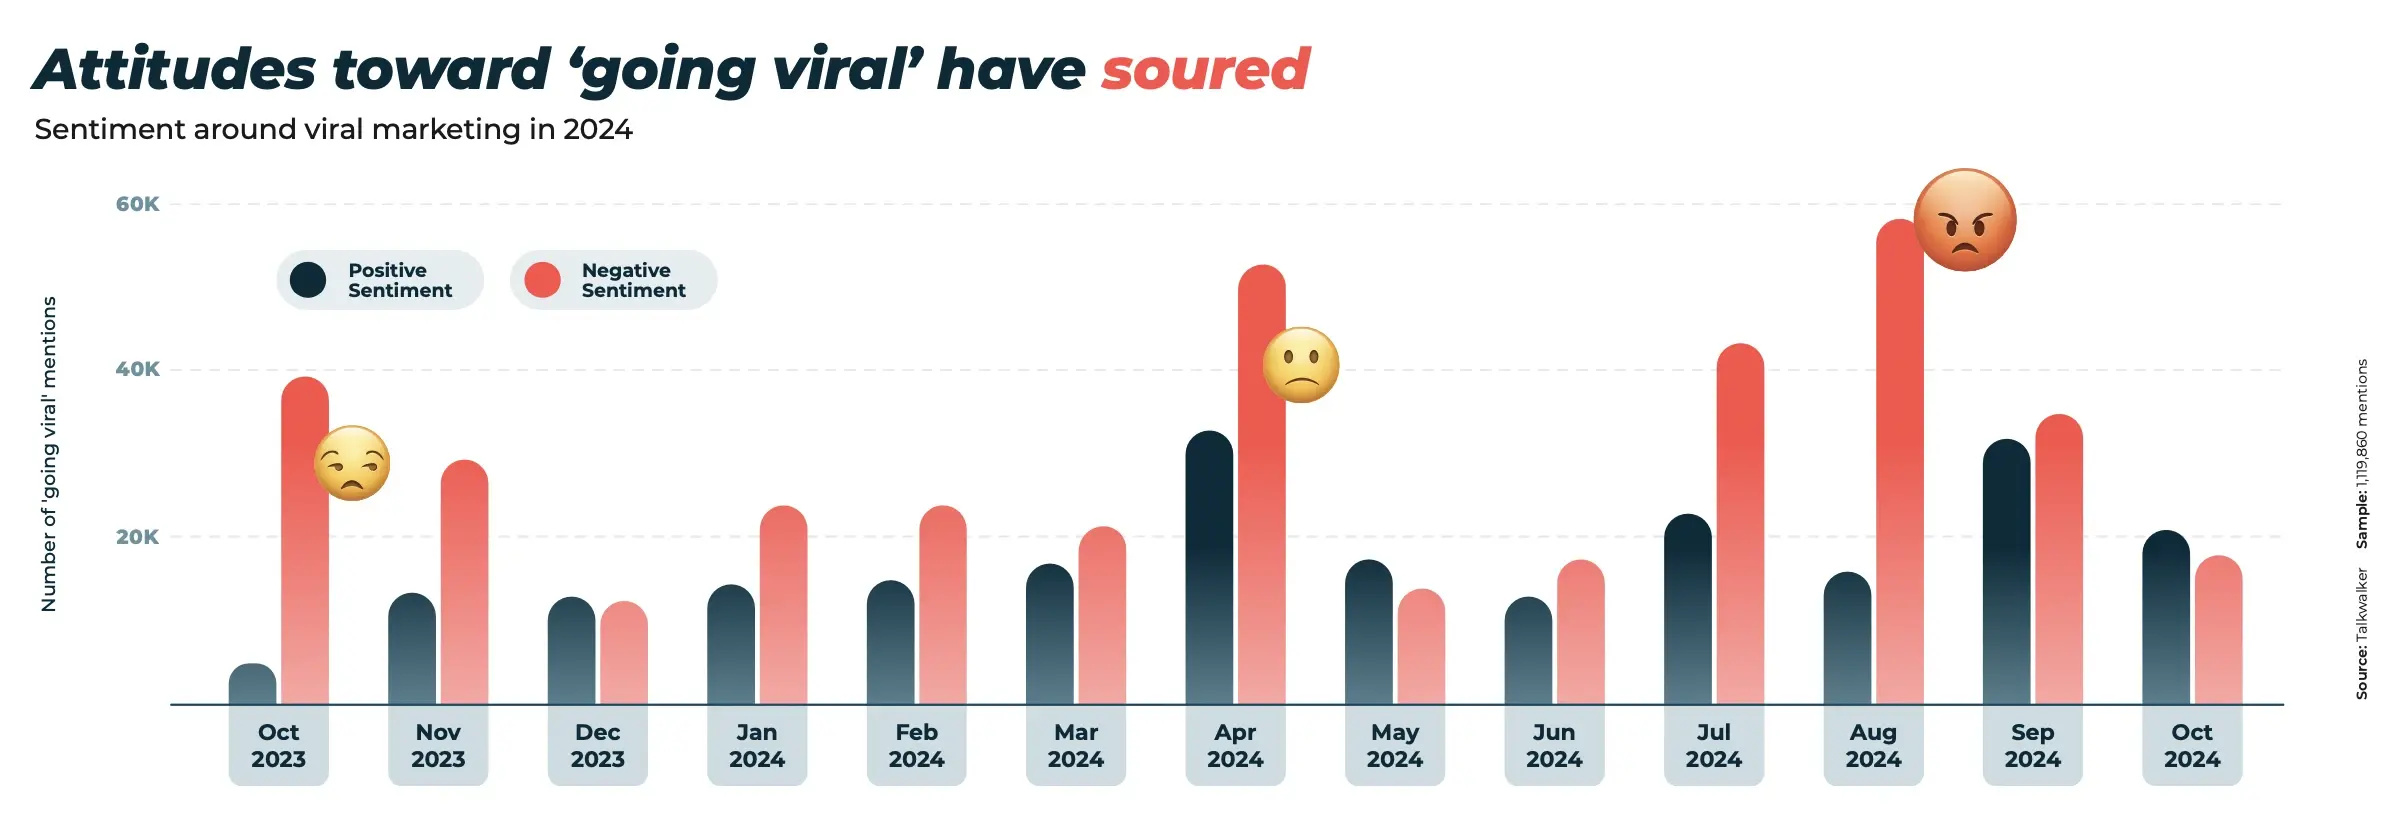
Source: Hootsuite
33. Optimal posting frequency varies by platform:
Instagram: 3–5 times/week
Stories: 2/day
Facebook: 1–2/day
LinkedIn: 2–3/day
Threads: 1–2/day
TikTok: 2–3/day
Pinterest: 3–5/week
Google My Business: 1/week
X (Twitter): 1/week
Key takeaways:
Value-driven content now dominates. Educational and entertaining posts have become the new "ad," replacing purely promotional content.
Speed matters more than volume. Social success requires consistent posting and real-time responses to audience engagement.
Smaller influencers deliver better results. Nano and micro creators respond more actively and drive stronger comment-based engagement, challenging the notion that reach equals influence.
Social media advertising statistics
34. Social ad spend is surging and nearing $300B globally. Marketers worldwide will spend about $276.7 billion on social media advertising in 2025.
35. This ad spending is expected to grow 10.09% annually between 2025-2029, reaching a projected $406.45 billion by 2029.
36. Mobile dominates ad delivery, with 83% of total ad spending expected to happen through mobile devices by 2029.
37. Consumers are influenced by social media more than ever before. 76% of people report purchasing products after seeing them advertised on social media.
38. Performance metrics show the following average results across industries:
Average Click-Through Rate (CTR): 0.90%
Average Conversion Rate: 9.21%
Average Cost per Click (CPC): $1.86
Average Cost per Action (CPA): $18.68
39. Meta's global advertising revenue is projected to reach $183.80 billion in 2025, marking a 14.9% year-over-year increase. This makes it the second-largest digital ad seller in the world, behind only Google.
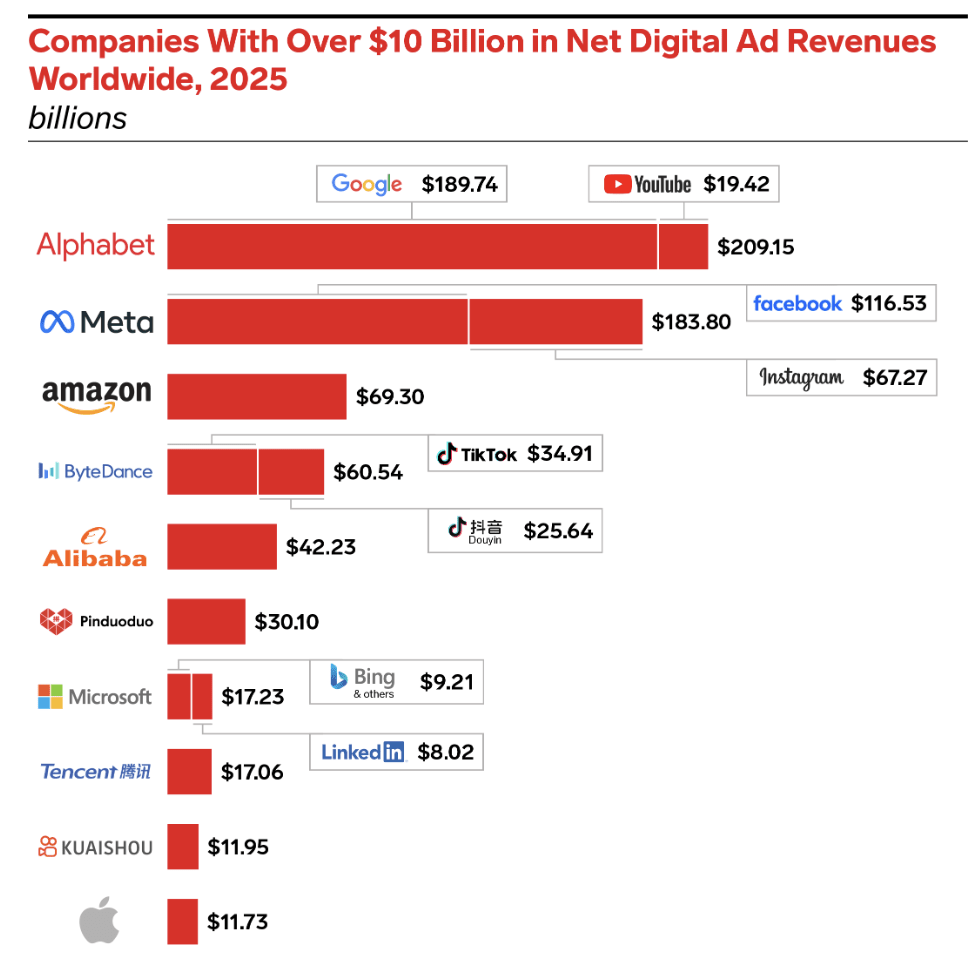
Source: Emarketer
Key takeaways:
With ad budgets steadily increasing, brands now treat social platforms as essential performance channels alongside search and display.
Most social ad views happen on mobile devices. This means successful campaigns are built around vertical formats, fast loading, and native-looking content.
Social ads are being used across the funnel. Not just to drive traffic, but to build awareness, spark engagement, and support long-term brand growth.
Social media listening statistics
40. 62% of marketers now actively use social listening tools to guide strategies and measure ROI. This ranks as their second-highest social media priority, just behind direct audience engagement.
41. The investment trend is clear: 55% of marketing professionals expect to increase time and resources devoted to social listening.
42. The global social media listening market reflects this growing importance. It's projected to nearly double from $9.61 billion in 2025 to $18.43 billion by 2030, growing at 13.9% annually.
43. Social listeners report significantly higher confidence in their ROI across platforms. On LinkedIn and Instagram, 76% of social listeners feel confident in their results, compared to 63% and 59% of non-listeners, respectively. The gap widens even further on Facebook, where 67% of listeners express confidence versus just 27% of those who don't use listening tools.
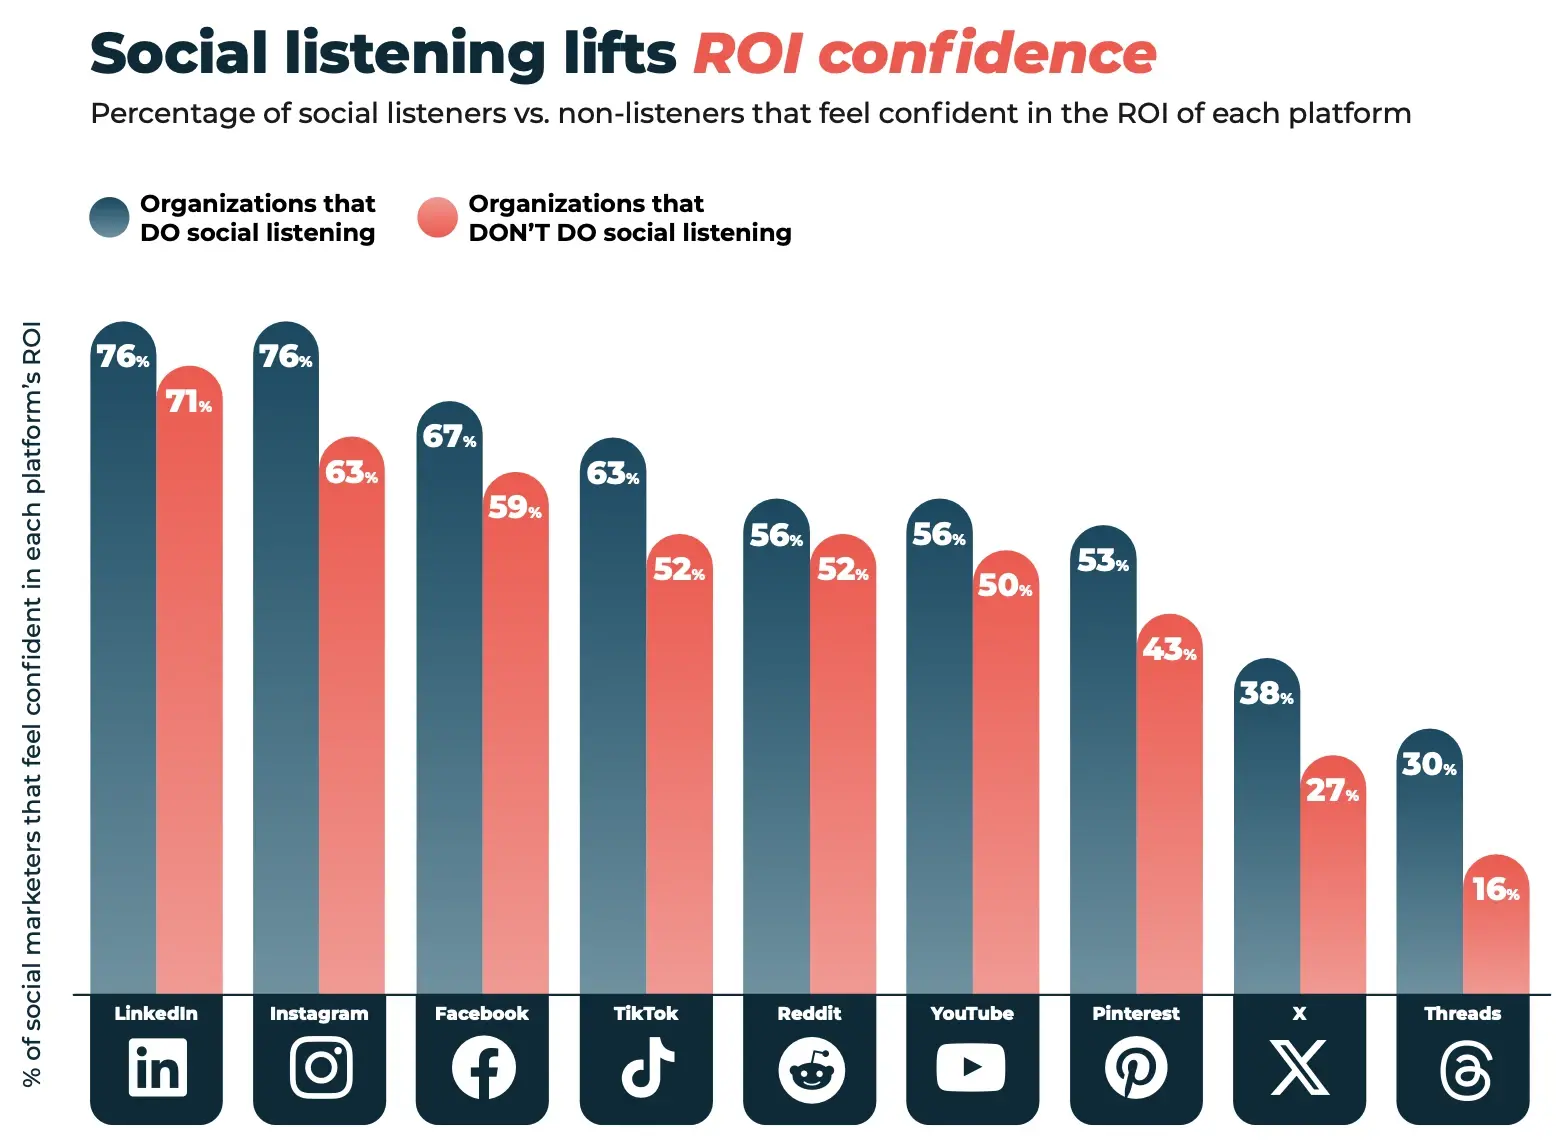
Source: Hootsuite
44. 31% of social listeners use their tools primarily to analyze cultural trends.
45. The tool landscape is consolidating. In 2024, 25% of companies were using just one listening tool (up from 16% last year).
Key takeaways:
Listening has become a leading indicator. It provides insights beyond brand sentiment, revealing cultural signals, trend timing, and campaign performance.
Brands using listening tools demonstrate more confidence and adaptability, catching shifts before they peak.
While tool usage is consolidating, value perception is rising. Marketers are investing less in quantity and more in strategic listening depth.
AI social media statistics
46. The adoption of AI for text creation has skyrocketed, growing by 86% between 2023 and 2024.
47. 77% of marketers now use AI to produce social media text from scratch.
48. 70% leverage AI to generate new social media ideas.
49. 41% use AI to create images for social media.
50. AI is impacting social listening as well. 90% of professionals in this field use generative AI to enhance their work in some capacity.
51. Influencer marketing sees tangible benefits from AI integration. 66.4% of practitioners report that AI has improved their campaign results either somewhat or significantly. Only 6.1% report worse outcomes.
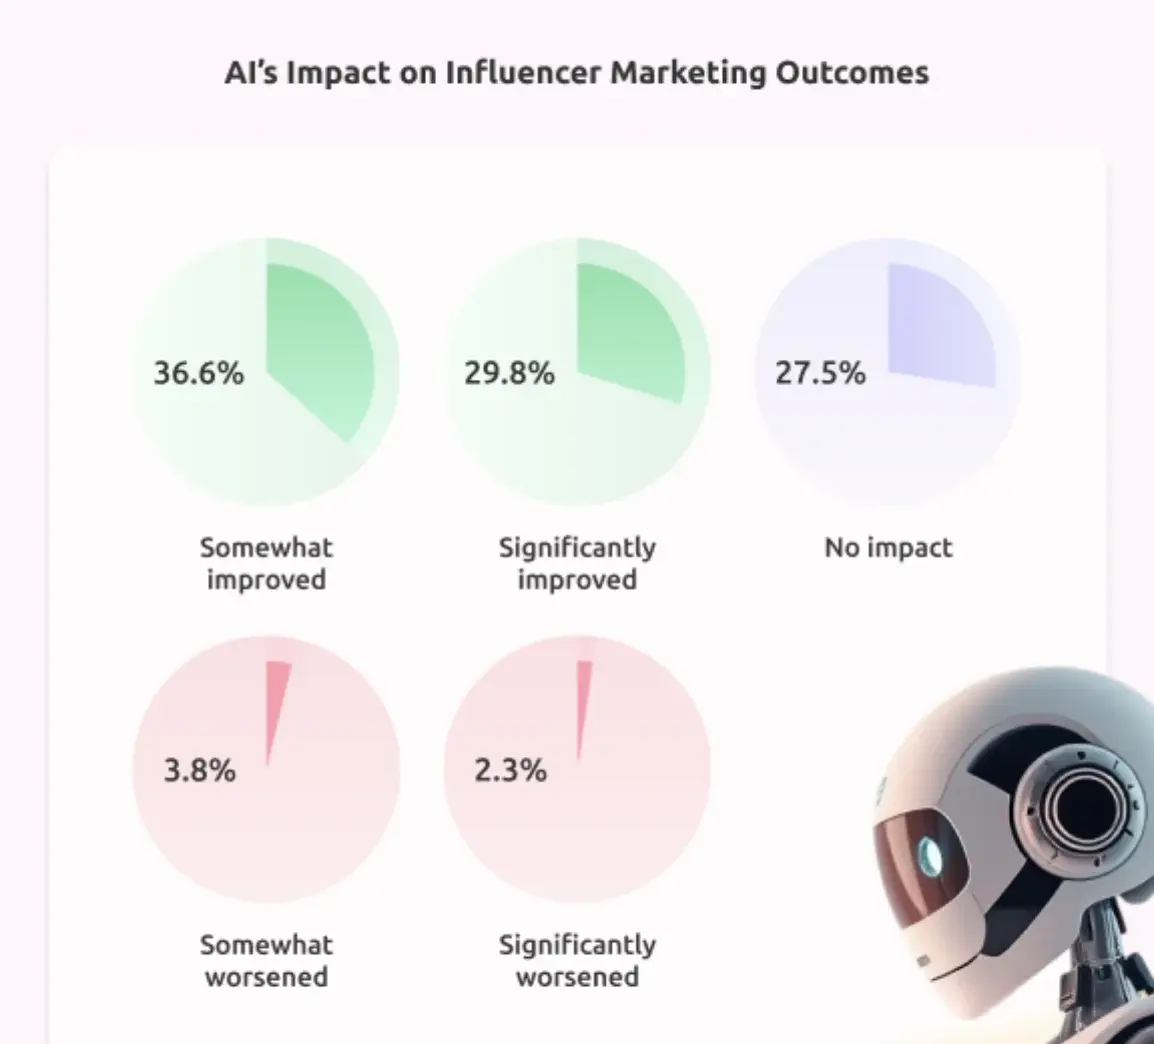
Source: Influencer Marketing Hub
52. The productivity gains are substantial. Nearly all (90%) businesses using GenAI for social content report moderate to significant time savings. Additionally, 73% have observed increased engagement and impressions from AI-assisted content.
53. User attitudes toward AI content vary by format. Entertainment-focused AI content receives positive reception, with 60% of users interested in AI-generated music and 57% in AI-generated comedy videos.
54. However, acceptance drops significantly for branded content. Only 34% of users express interest in AI-generated ads.
55. The virtual influencer market reflects this growing AI presence. Industry projections estimate it will reach $37.8 billion by 2030.
Key takeaways:
AI is moving from novelty to necessity. Not simply for speed, but for shaping creative direction, tone, and even influencer fit.
While AI content performs well, audiences draw the line at authenticity. It works best when it’s something fun or helpful, not when it replaces a human voice.
The future of influence may not be 100% human. “Virtual influencers are on the rise, and AI is reshaping the influencer model by improving campaign results.
Instagram statistics
56. Instagram ranks as the 3rd most visited website globally, demonstrating its massive reach.
57. With more than 500 million daily active users worldwide, Instagram's audience remains substantial and engaged.
58. Instagram generates 4.2 billion likes every day. However, overall engagement has declined by 28% year-over-year, resulting in a 2025 engagement rate of 0.50%.
59. Demographics reveal Instagram's appeal to younger audiences:
Young adults (18–34 years) comprise 61.1% of all Instagram users globally
The single largest age group is 18–24-year-olds at 30.8%
25–34-year-olds follow closely at 30.3%
Users aged 35–44 represent 16.1% of users, showing growing adoption among older Millennials and younger Gen X
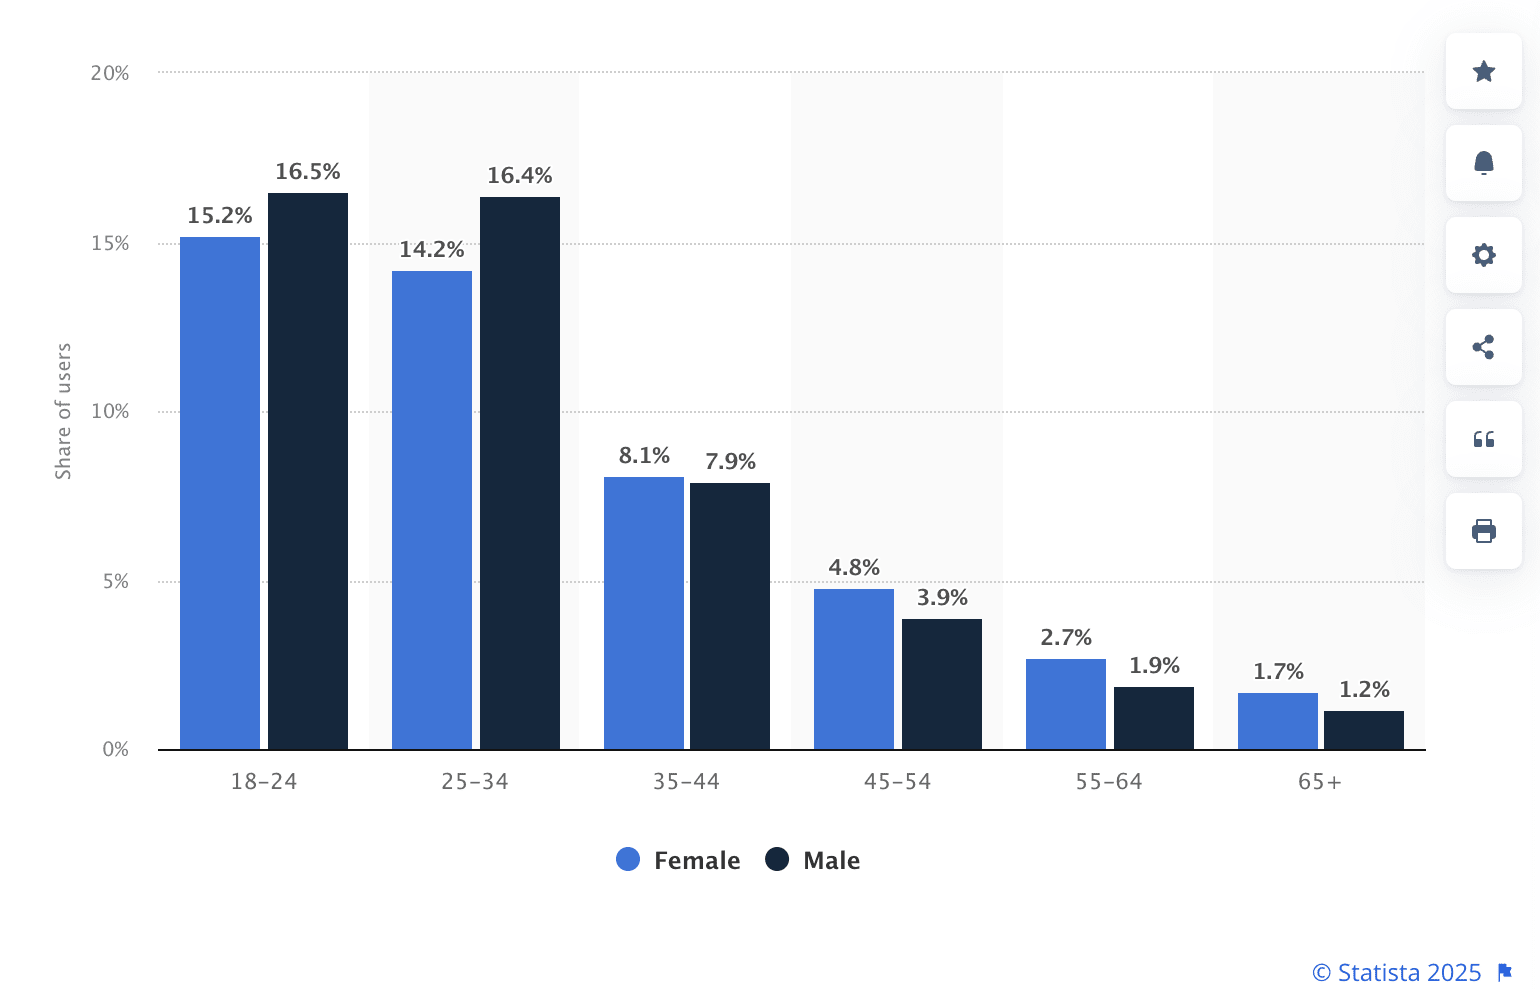
Source: Statista
60. Video content dominates user behavior, accounting for more than 60% of time spent on the platform. This shift toward video reflects broader trends across all social platforms.
61. Stories remain a cornerstone feature, with over 500 million people using Instagram Stories daily.
62. In total, users spend an average of 29.2 minutes per day on the app, making it one of the most time-intensive social media sites.
Key takeaways:
Instagram is still a cultural staple. But its power has shifted from posts to stories and Reels, where ephemeral and video-first content thrive.
Engagement stays strong despite fluctuations, and vertical video drives significant user engagement. Especially from younger users.
The app's age split (18–34 year-olds dominate) makes Instagram an important platform for reaching young adult consumers.
Facebook marketing statistics
63. Facebook ranks as the second most visited website in the world, demonstrating its continued relevance.
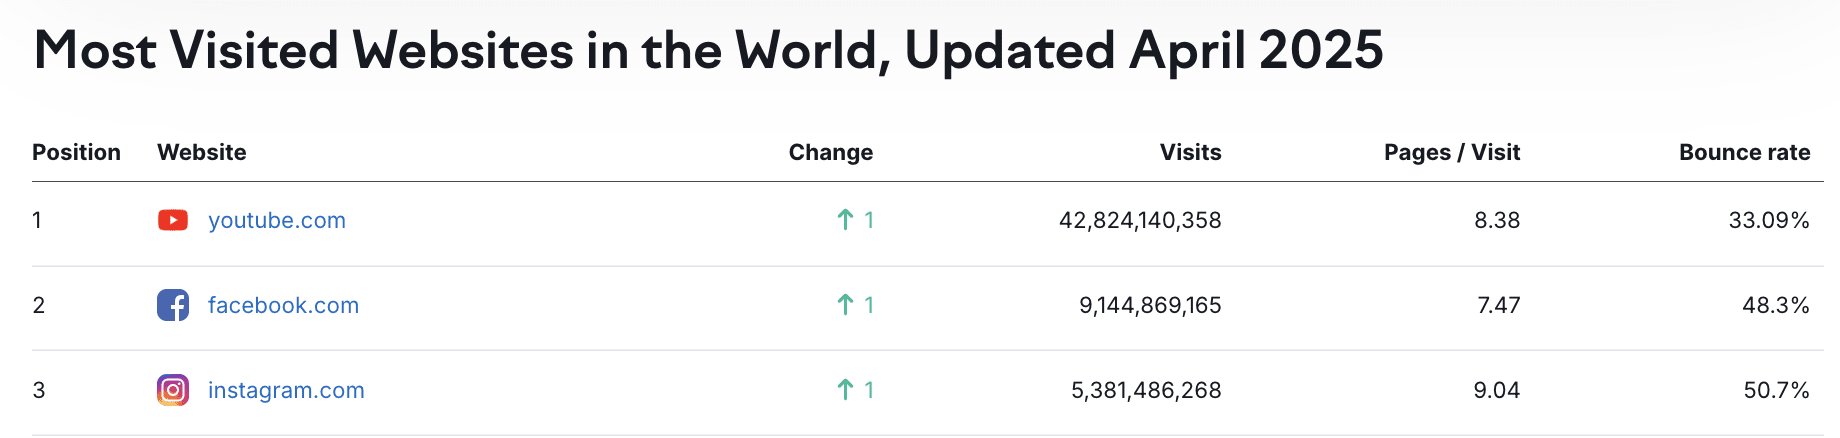
Source: Semrush
64. A higher percentage of U.S. adults aged 50–64 (70%) use Facebook compared to those aged 18–29 (68%). However, because millennials are a larger and more active group overall, they still make up nearly half of Facebook’s total user base.
Source: Pew Research Center
65. The platform maintains massive daily engagement. With 2.11 billion daily active users, representing 68.73% of its monthly active user base, Facebook remains a "daily habit" for billions despite competition from newer platforms.
66. Engagement varies significantly by content type. Facebook pages average just 0.15% engagement per post, reflecting the platform's algorithmic filtering. However, Facebook Groups drive much higher participation rates.
67. Groups have become Facebook's engagement hub, with over 1.8 billion users participating in Groups monthly. This represents a major shift toward community-focused interaction.
68. Content discovery on the platform is evolving too. 31.9% of U.S. Feed organic views now come from in-Feed recommendations rather than direct connections.
69. The core use case remains consistent: 93% of U.S. Facebook users say they primarily use the app to keep up with friends and family.
Key takeaways:
Facebook's "boomer" stereotype hides a deeper truth: it remains a daily habit for billions and a core social platform for older users.
Groups are Facebook's secret weapon, offering high engagement in interest-based or community-driven spaces that feel more private.
Organic Page performance is low, but in-feed discovery and Group participation offer meaningful ways to drive interaction.
TikTok statistics
70. The projected number of TikTok users worldwide in 2025 is 955.3 million, representing a 6% increase from 2024's 900.7 million users.
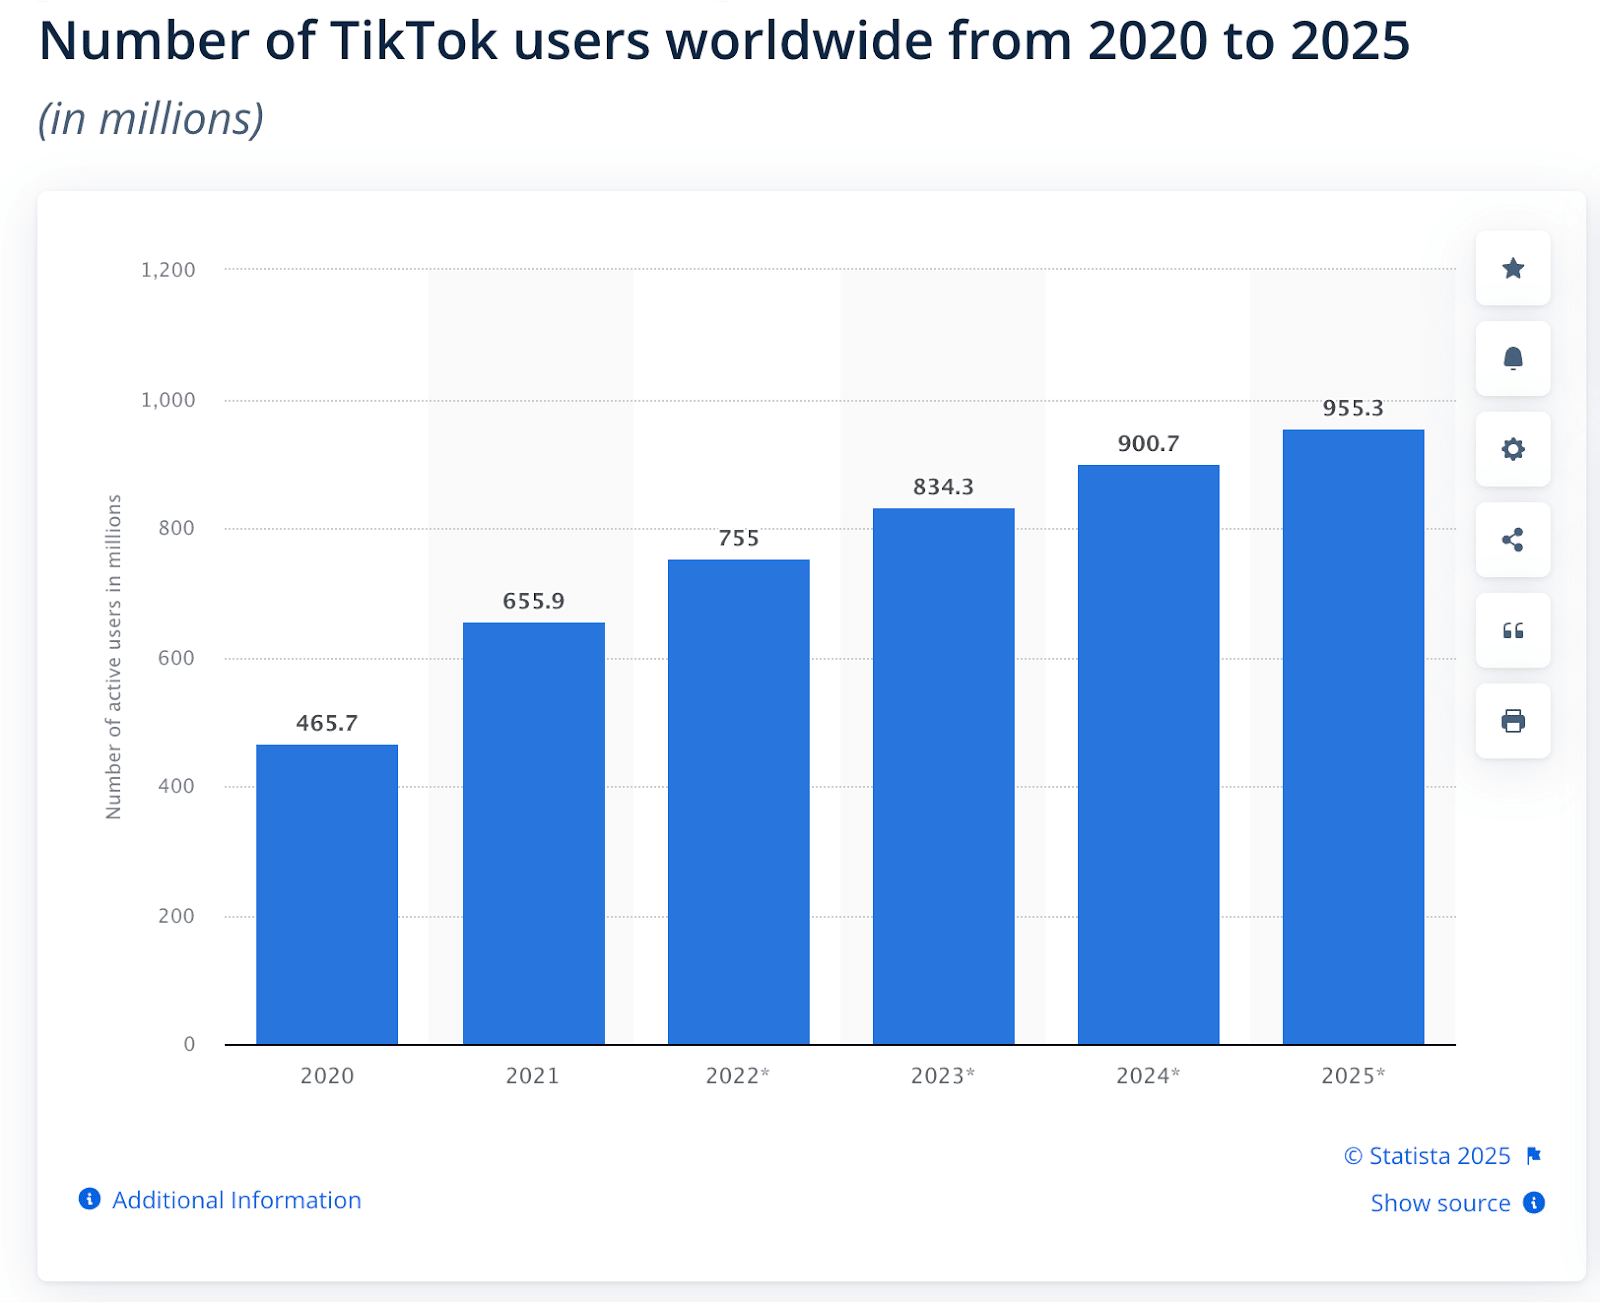
Source: Statista
71. TikTok's web presence has become substantial. As of March 2025, TikTok.com receives around 2.18 billion monthly visits, with approximately 700 million unique monthly visitors.
72. The platform's monetization efforts are paying off. Globally, TikTok's ad revenue is forecasted to reach $32.4 billion in 2025, despite ongoing regulatory uncertainties in the U.S.
73. The platform's advertising reach is remarkable. TikTok ads reached 19.4% of the entire global population in January 2025.
74. TikTok has evolved beyond entertainment into an information source. About half of TikTok users (52%)—equivalent to 17% of all U.S. adults—say they regularly get news on the platform.
75. User engagement remains strong and consistent, with an engagement rate of 2.50%.
76. The platform is increasingly driving purchases. In 2024, 43.8% of TikTok users in the U.S. made at least one social ecommerce purchase on the platform, up 27.3% from 2023.
Key takeaways:
TikTok is now a full-funnel engine, from trend to purchase, especially for younger audiences.
It excels at inspiring impulse purchases thanks to how well its algorithm understands timing and intent.
While platform uncertainty remains in markets like the U.S., TikTok's cultural influence and e-commerce growth show no signs of slowing globally.
Threads statistics
77. Threads ranks as the 26th most popular social media platform based on monthly active users and organic traffic, with 275 million MAU.
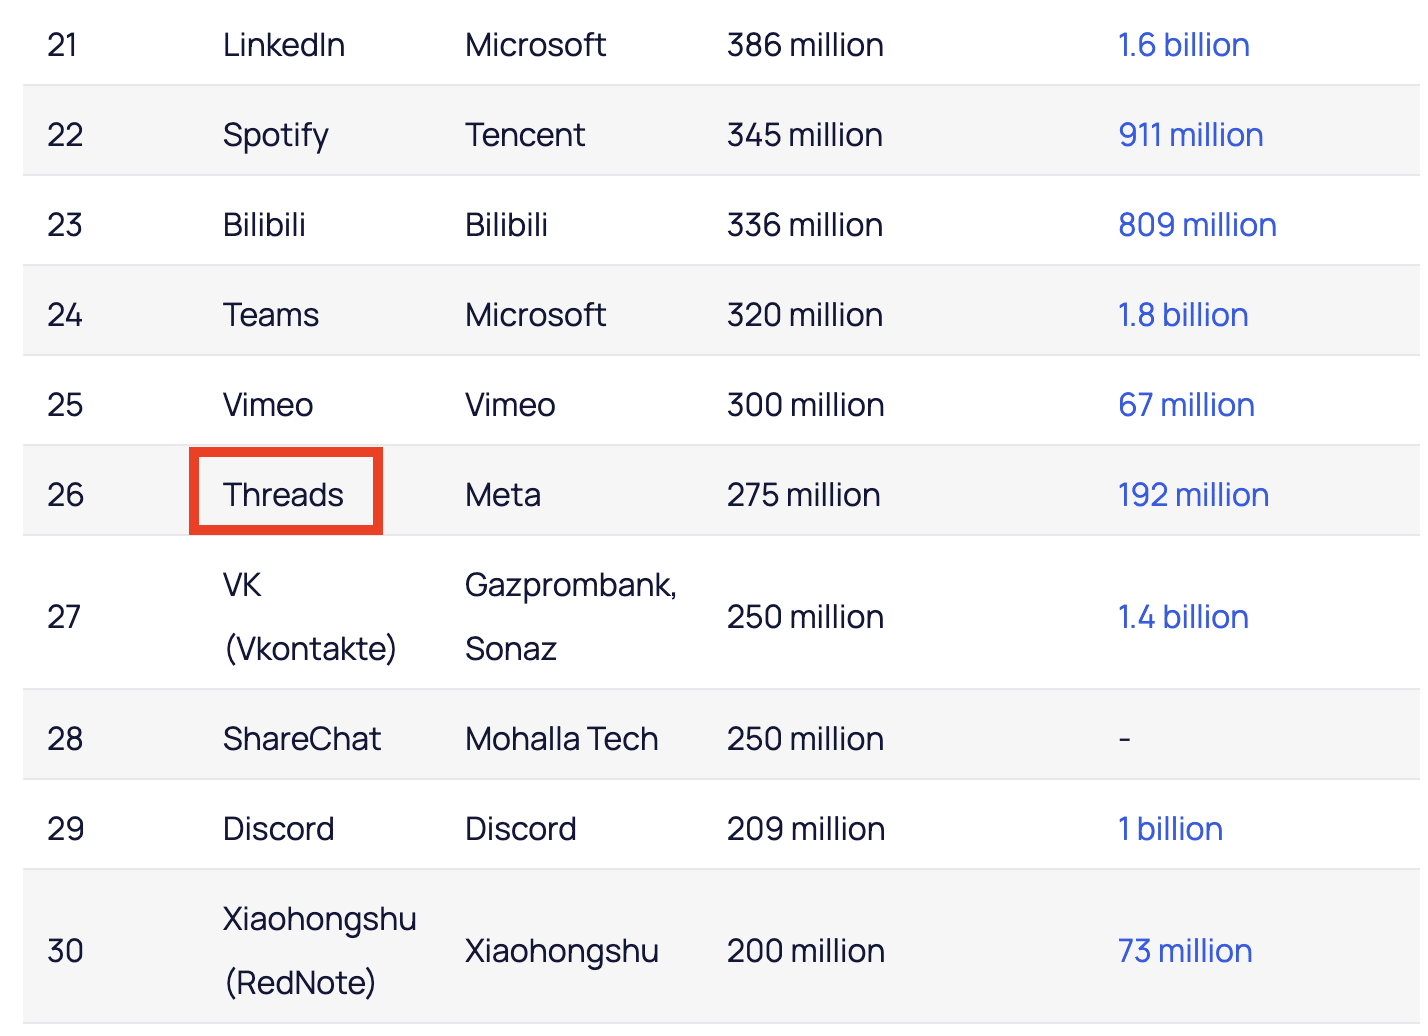
Source: Exploding Topics
78. The platform maintains 10 million daily active users worldwide, showing steady growth since its July 2023 launch.
79. In March 2025, Threads generated approximately 18 million downloads worldwide, indicating ongoing interest.
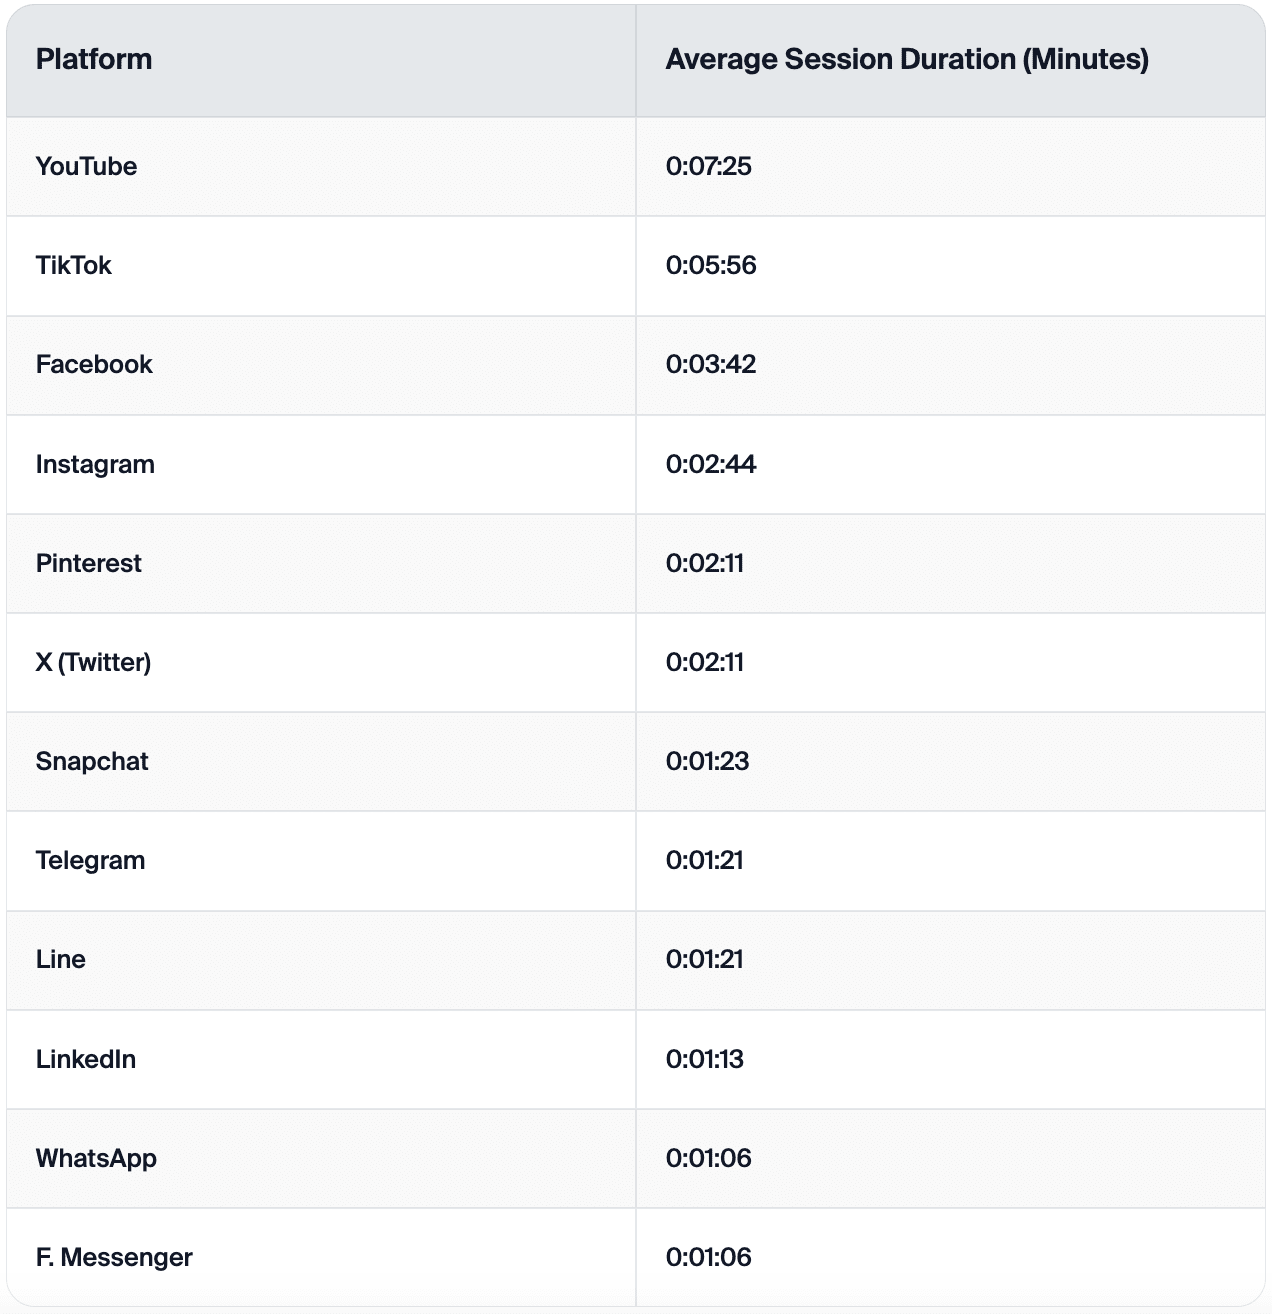
80. User engagement shows encouraging patterns. Users spend an average of 34 minutes per session on Threads.
81. Demographics skew relatively young. Users aged 25-34 constitute 29% of the user base, while those aged 18-24 make up 20.4%.
Key takeaways:
Threads is carving out a role as a slower, more intentional space for persistent, contextual conversation.
Adoption is rising among younger users, especially those fatigued by Twitter/X but still wanting real-time dialogue.
The average session length shows that users stick around once they're in. This indicates potential for deeper engagement if brands adapt tone and pacing.
Twitter (X) social media statistics
82. Twitter ranks as the 8th most popular social media platform with 909 million monthly active users globally.
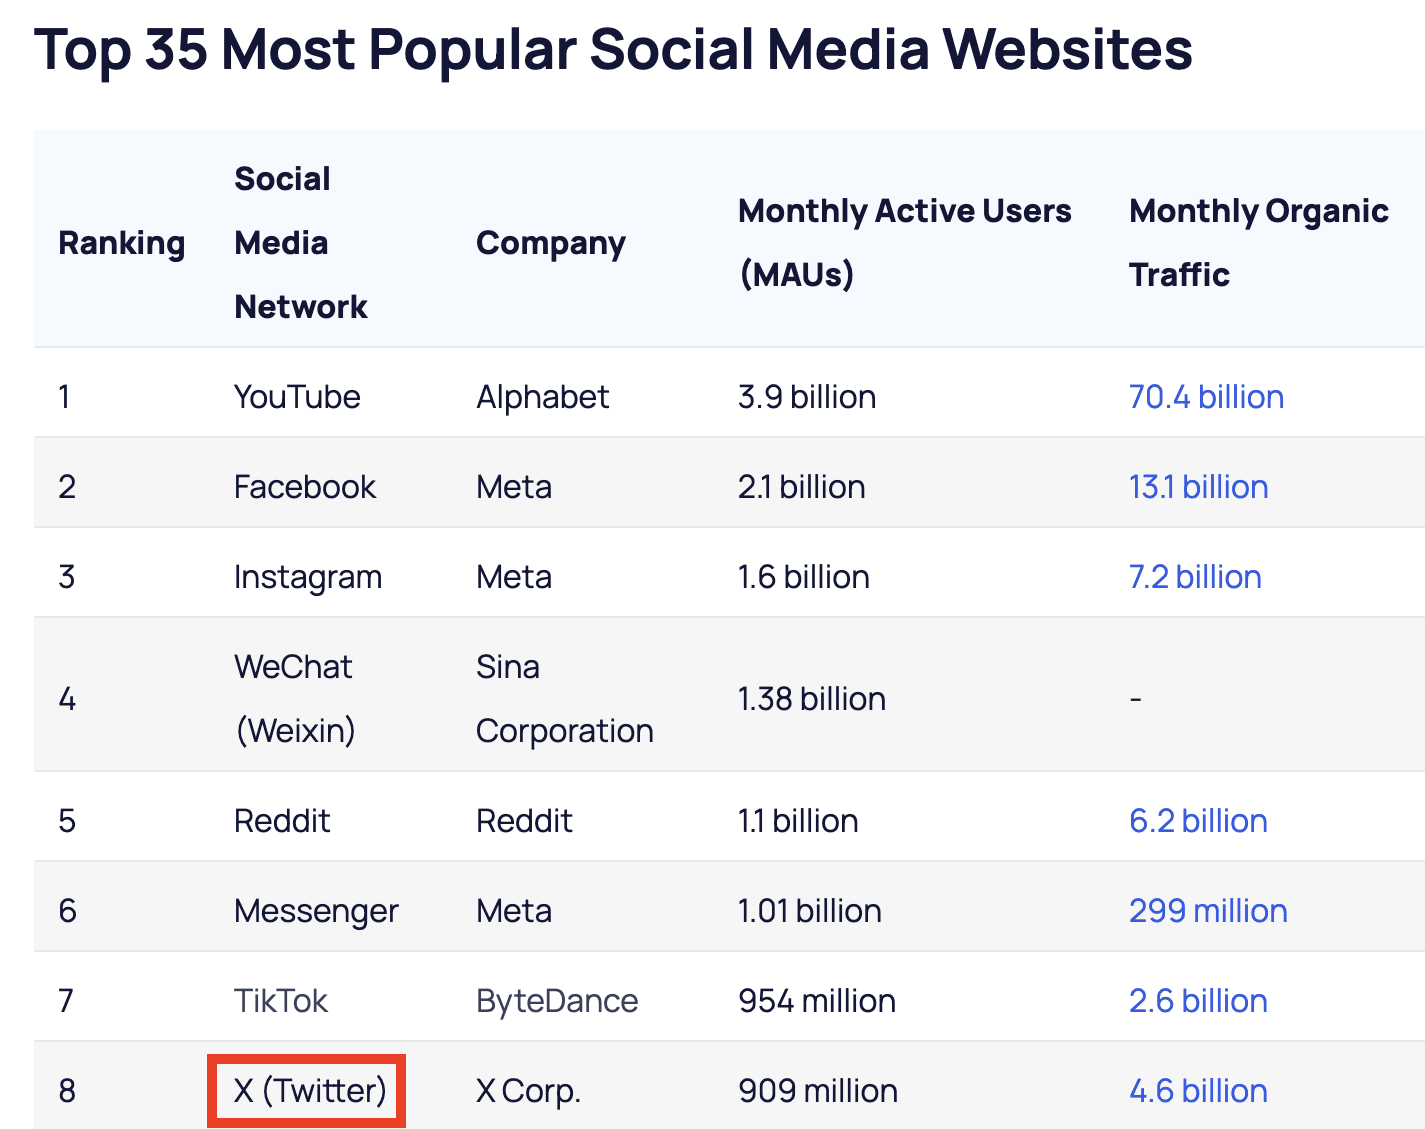
Source: Exploding Topics
83. In early 2025, X had 104 million active users in the United States, representing 30.0% of the total U.S. population.
84. Users in the United States spend a substantial amount of time on the platform, averaging 34 minutes and 6 seconds daily.
85. Content creation follows the 90/10 rule: the top 10% of users create 92% of all tweets, indicating a highly active minority drives most platform content.
86. Most X users (58%) are under 35 years old, proving that the platform’s audience is still quite young.
Key takeaways:
Content on the platform is driven by a vocal minority, which shapes what users see and how trends emerge.
The platform's real-time nature still makes it powerful for news, culture, and fast reactions. But less so for brand storytelling or evergreen content.
The demographic is younger than expected, challenging assumptions that it's becoming obsolete.
Reddit social media statistics
87. The platform ranks as the 5th most popular social media platform with 1.1 billion monthly active users.
88. User activity is substantial. In 2024, Reddit users generated approximately 550 million posts and 2.72 billion comments.
89. The platform houses over 141,000 active subreddits, with r/funny leading as the most popular community at 64 million members.
90. Mobile has become the dominant access method. Reddit experiences over 3.5 times more mobile devices visits than desktop visits monthly, indicating a shift away from its traditionally desktop-centric user base.
91. Demographics skew younger, though not exclusively so. 44% of U.S. Reddit users are aged 18-29, while 31% are aged 30-49.
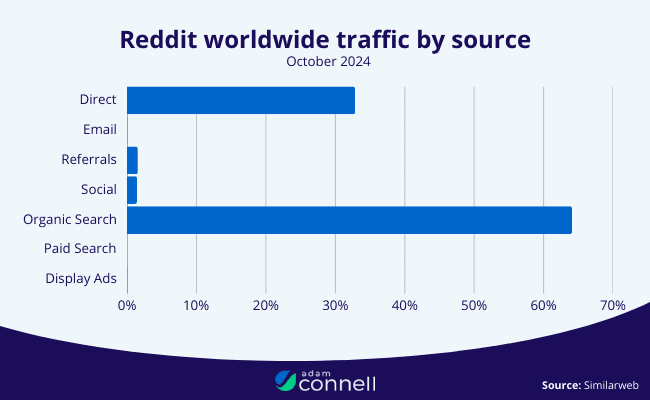
92. Search visibility is a major strength. Organic search accounts for
Key takeaways:
Reddit is where depth lives: with long-form conversation, niche expertise, and authentic engagement outperforming polished posts.
Its SEO and search traffic strength means Reddit often becomes a brand's first impression, even if they're not on the platform.
High mobile usage shows that Reddit is not just for desktop lurkers. It's becoming an everyday mobile habit.
LinkedIn statistics
93. LinkedIn ranks as the 21st most popular social media platform with 386 million monthly active users.
94. User engagement is more focused than extensive. For example, the average user spends about 51 minutes a month on the platform, a lower number than on other platforms.
Source: Soax
95. Web traffic shows significant volume. LinkedIn.com ranks #23 in the United States with 1.72 billion monthly visits.
96. Demographics span working ages broadly. In the U.S., LinkedIn usage by age group shows: 40% of adults aged 18-29, 41% aged 30-49, 30% aged 50-64, and 15% aged 65 and older.
97. Platform activity is substantial despite lower time per user. LinkedIn members interact with LinkedIn Pages more than 2 billion times per month.
98. Job seeking remains a core use case. Each week, over 65 million people actively search LinkedIn for their next position.
Key takeaways:
LinkedIn is built around intent. Most users are there to connect, learn, or make career moves, not just passively scroll.
It plays a unique dual role: a professional network and a content platform, especially for thought leadership and employer branding.
Time spent is lower than on other platforms, with users typically logging in during work breaks or for a specific task. However, this engagement tends to be more focused, making interactions more deliberate and valuable.
Pinterest social media statistics
99. Pinterest ranks as the 20th most popular social media platform with 417 million monthly active users.
100. Demographics show particular strength among younger adults and women. The majority of Pinterest's user base is between 25 and 34 years old, and approximately 70% of Pinterest users are female.
101. The platform drives purchasing decisions effectively. 44% of millennial Pinners have bought a product they discovered on Pinterest.
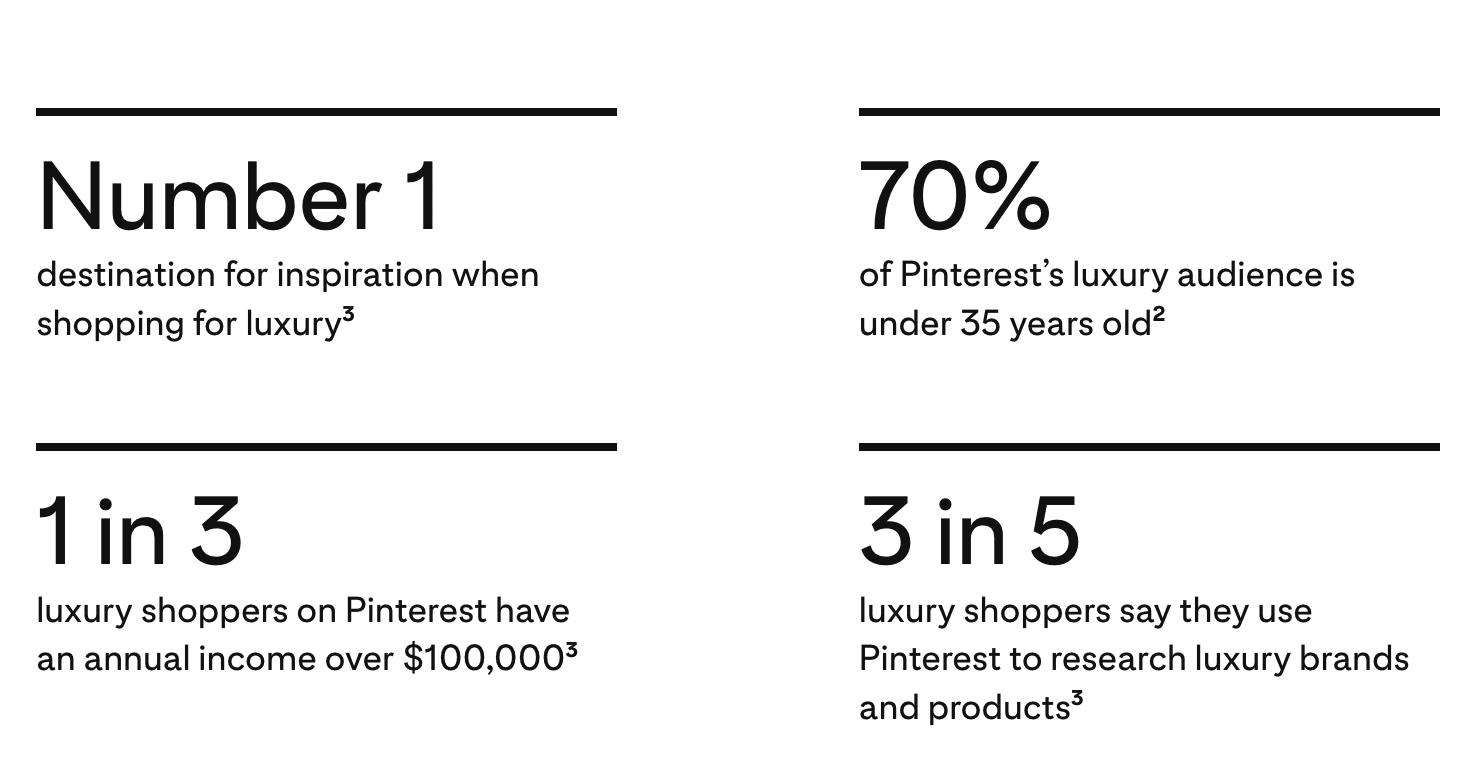
102. Pinterest has particular appeal among luxury consumers. 70% of its luxury audience is under 35, and they spend 87% more on luxury goods than shoppers on other platforms.
Source: Pinterest
Key takeaways:
Pinterest functions more like a visual search engine than a social feed. Users come with a purpose, whether that's inspiration or product discovery.
It remains especially strong in lifestyle, home, fashion, and wellness categories, where visuals drive early buying decisions. Especially for female users.
The platform's strength lies in its ability to quietly influence what people plan, want, and eventually purchase.
Bluesky statistics
103. Bluesky has surpassed 35 million registered users as of April 2025, marking significant growth for the relatively new platform.
104. In the U.S. and U.K., Bluesky reports approximately 3.5 million daily active users.
105. Demographics show a young, male-skewing user base. Over 62% of Bluesky users are under the age of 35, indicating strong appeal among younger demographics.
106. Gender distribution leans male, with 63% of users identifying as men.
Key takeaways:
Bluesky remains small. But it’s gaining traction with tech-forward users tired of algorithm-heavy platforms.
People join for genuine conversation without the popularity contests of other networks.
Its young, tech-savvy crowd makes it an early warning system for spotting trends.
YouTube statistics
107. YouTube is the most visited platform in the world in terms of traffic, outpacing Facebook, Instagram, and other websites like ChatGPT.

Source: Semrush
108. The platform's reach is massive, with 2.74 billion people accessing YouTube at least once a month.
109. Content creation remains extraordinarily robust. Creators upload over 500 hours of video every minute, resulting in approximately 720,000 hours of new content daily.
110. Unlike many social platforms, YouTube's appeal spans all age groups. In the U.S., YouTube usage by age shows remarkable penetration: 95% of adults aged 18-29, 94% of those 30-49, 86% of those 50-64, and 65% of adults 65 and older use the platform.
111. Different demographics use YouTube in distinct ways. Kids and teens are important consumers, with YouTube often serving as the default platform for children's content (leading to the creation of the YouTube Kids app). Meanwhile, Gen X and Boomers use YouTube mainly for how-to guides, news, and music.
Key takeaways:
YouTube blends search, streaming, and education in one place. It's how people find everything from entertainment to how-to guides.
Everyone uses YouTube, but differently: kids follow creators, while older adults watch tutorials and news clips.
Shorts brought in quick-hit viewing, but longer videos still capture most watch time and deeper engagement.
Social media video statistics
112. Instagram Reels engagement has surged 25% since Q4 2021. The platform has responded by expanding the maximum video length to 3 minutes for users seeking longer-form content.
113. YouTube's Shorts feature has quickly gained traction. Over 50% of YouTube users now engage with Shorts monthly, demonstrating the format's broad appeal.
114. Video now accounts for the majority of time spent on Instagram. The platform reports that Reels make up 50% of all time users spend on IG.
115. Across all platforms, short-form video has become the most noticed social content type, outperforming static images, carousels, and text-based posts.
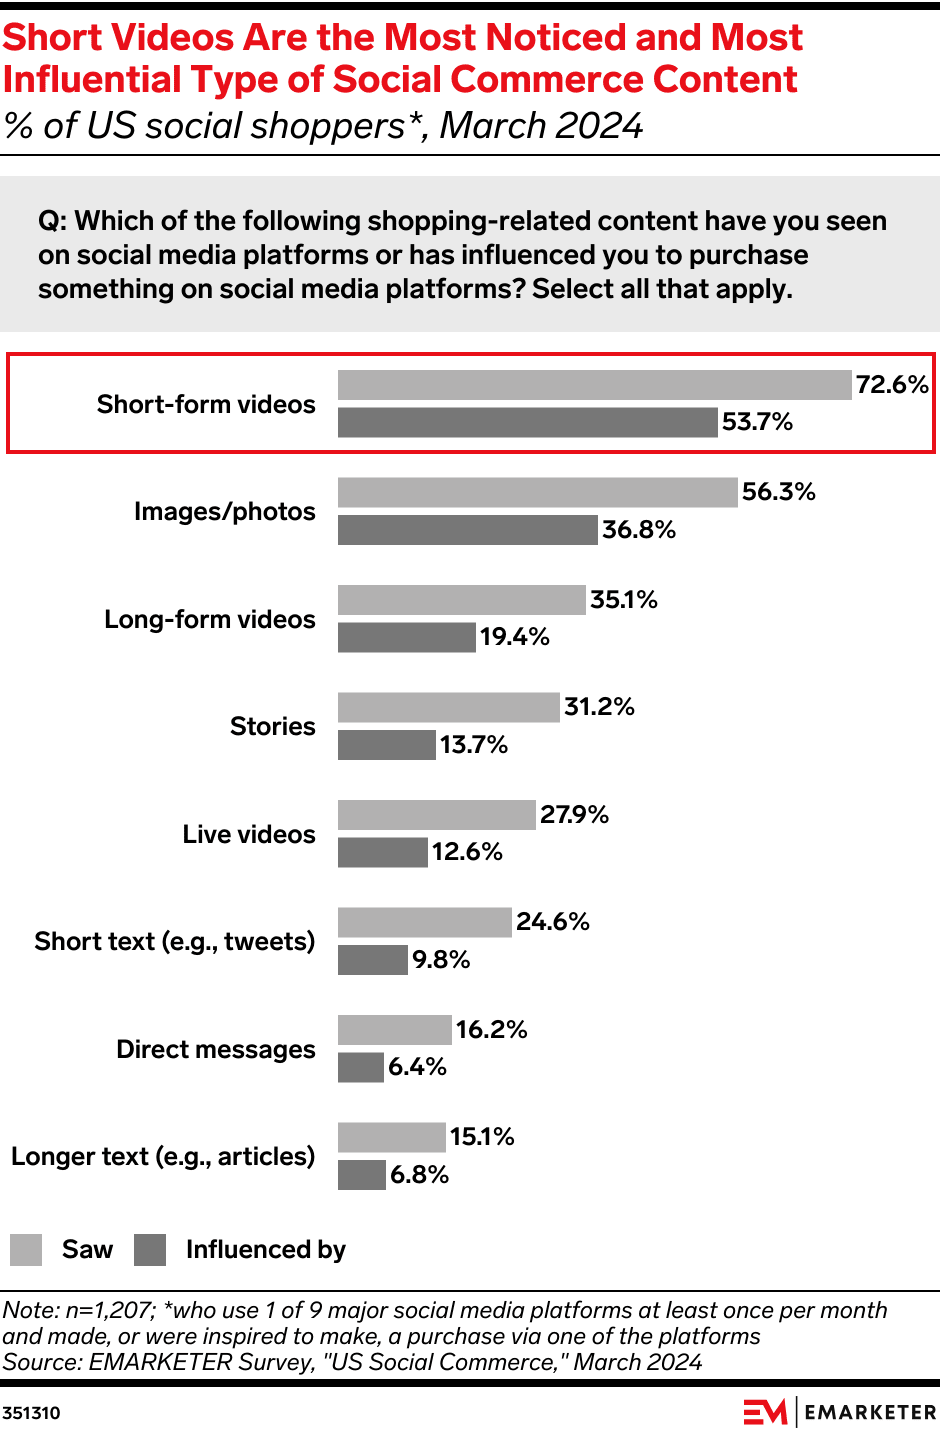
Source: Emarketer.
Key takeaways:
Quick videos have taken over how people consume content. Whether for fun, shopping, or learning.
Many platforms now push video first, tweaking time limits and algorithms to keep users watching.
Brands stuck in static image mode are disappearing from feeds. Movement, speed, and platform-specific styles now win attention.
Influencer marketing statistics
116. Over 80% of marketers see influencer marketing as a highly effective strategy for reaching and engaging target audiences.
117. The ROI remains impressive. The average business generates $5.78 for every $1 spent on influencer marketing campaigns.
118. Smaller creators now dominate the landscape. Nano-influencers accounted for 75.9% of Instagram's influencer base in 2024, reflecting a shift toward more authentic, niche voices.
119. Virtual influencers are gaining traction. 59% of consumers follow virtual influencers on YouTube, followed by TikTok (56%), Instagram (51%), and Twitch (18%).
120. Trust remains a challenge for virtual personalities. Only 15% of customers rank their trust in products advertised by virtual influencers at 7 out of 10 or higher.
121. 43.5% of consumers have never made a purchase influenced by a virtual influencer, but
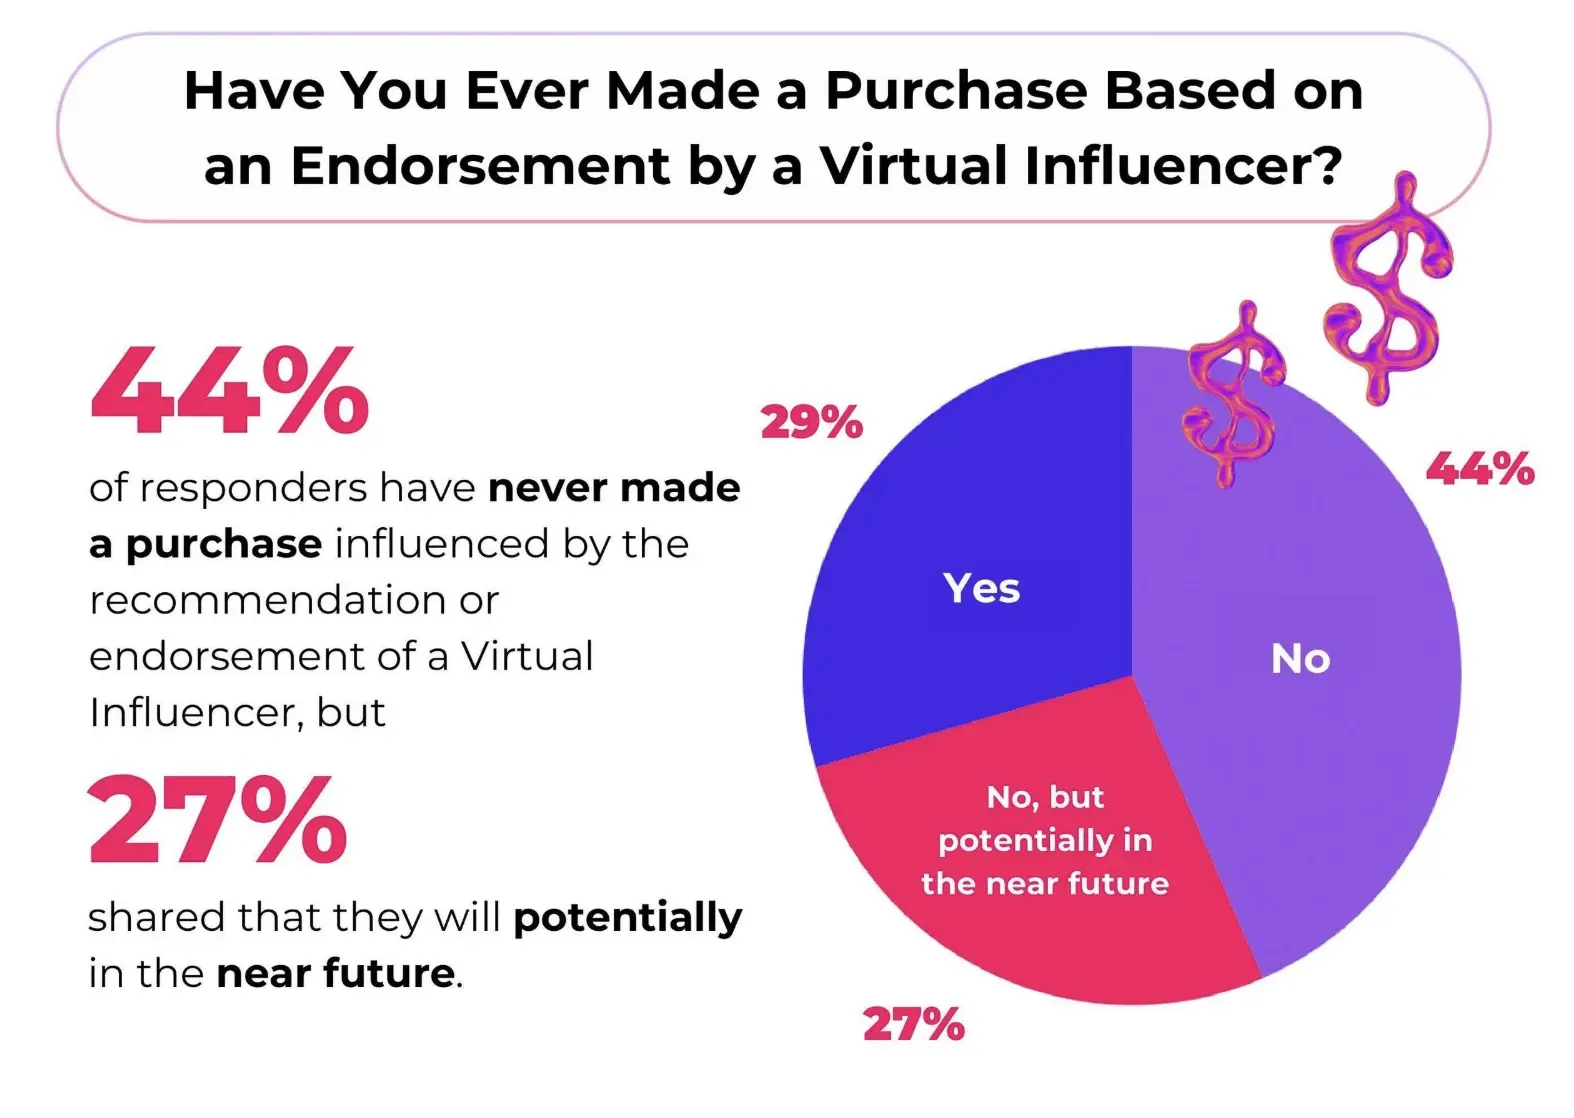
Key takeaways:
Trust drives influencer success. Nano and micro creators with authentic voices now outperform celebrity accounts.
AI-powered virtual influencers are growing, but real humans still connect better with audiences.
Smart brands now build ongoing relationships with creators instead of one-off sponsored posts.
Social media buying behavior statistics
122. Direct purchasing through social platforms has more than doubled in recent years. 46% of consumers report buying products directly through social media—up from 21% in 2019.
123. Privacy concerns remain prevalent. 67% of consumers express worries about privacy and data sharing on social media platforms.
124. Social proof plays a crucial role in purchase decisions. 82% of consumers look for reviews to validate a company before buying a product from social media.
125. The market size reflects this growing behavior. Social commerce sales are projected to surpass $1.2 trillion globally by 2025.
126. In the U.S. alone, 100.7 million Americans (36.8% of online consumers) shopped on social media in 2024.
127. Younger consumers lead this trend. Approximately 70% of Gen Z consumers have made a purchase because something appeared in their social media feed.
128. Platform influence varies. 28% of users agree that TikTok inspired impulse purchases, more than any other platform.
Key takeaways:
Social platforms are now essential at every stage of shopping. From first seeing a product to hitting "buy."
Quick purchases happen most when content looks good, others recommend it, and buying is just a tap away. Gen Z leads this behavior.
Despite privacy worries, people still shop on social. They're just pickier about which brands earn their trust.
FAQs
How many people use social media in 2025?
Over 5.2 billion people, about 64% of the global population, use social media in 2025. That means roughly two-thirds of everyone on Earth is active on at least one platform.
What are the most popular social media platforms in 2025?
The top five platforms by monthly active users and organic traffic are:
YouTube
Facebook
Instagram
WeChat
Reddit
TikTok ranks 7th, X (formerly Twitter) 8th, LinkedIn 21st, and Threads 26th.
How successful is social media marketing in 2025?
Social media marketing delivers measurable result. But with some caveats.
Conversion rates typically range from 2% to 5%, and CTR averages around 0.90%. Showing that well-optimized content can perform across platforms.
AI-assisted campaigns are also gaining traction, with 73% of businesses reporting better engagement and impressions when using GenAI tools.
Influencer marketing remains highly effective, with an average ROI of $5.20 per $1 spent, especially with niche creators.
However, social traffic can be unpredictable.
Organic reach has declined on many platforms, and referral traffic from social often accounts for just 5–15% of total website visits, depending heavily on industry and content strategy.
Attribution also remains a challenge, as conversions influenced by social may be completed elsewhere.
The bottom line: social media works, but it's most effective when paired with smart creative, responsive engagement, and multi-channel follow-through.
Is social media use increasing?
Yes, social media usage continues to rise steadily:
Global users grew 4.7% year-over-year in early 2025.
Over 72 million new users join every quarter — about 7 people per second.
People are now active on an average of 6.8 platforms per month.
What are the best social media marketing tools in 2025?
The right tools make all the difference in your social strategy. The top-ranked tools you can try in 2025 include:
Talkwalker for multiplatform social listening, tracking sentiment, and spotting trends
Hootsuite for day-to-day social media management and analytics
What this means for you
We’ve examined the key social media statistics for 2025.
But these aren't just numbers. They're opportunities for brands willing to adapt.
Here’s what you should prioritize:
Make video your default format if it fits your audience's needs. Short clips for discovery, longer content for depth.
Build communities, not just followers. Groups and micro-communities drive 3- 5x more engagement than broadcasting to everyone.
Use listening tools to spot shifts early. Don't wait for trends to hit mainstream. By then, you're already late.
Stop treating platforms as identical. Each has a specific purpose: TikTok for discovery, LinkedIn for professional content, Reddit for deeper discussions.
Use AI strategically. The majority of social media marketers use AI for content creation. But users are skeptical of obviously AI-generated ads and branded content. Use it for ideas and efficiency, not to replace authentic voice.
Check out what are the Social Media Trends in the UK. Want to spot trends before your competitors do? Try Talkwalker’s social listening tools to track real-time conversations in your niche.