


We all understand the power of social media in driving awareness and engagement around television. But given its fractious nature, giant scale, and competing platforms it’s an ongoing challenge to confidently measure its impact. While programmers trust Talkwalker’s Social Content Ratings® (SCR) to quantify the engagement and video views of their owned social strategies across their network, program and talent accounts, delivering comprehensive earned measurement across social platforms has been a more difficult challenge to meet in the market.
This past December Talkwalker released an innovative measurement enhancement to their SCR solution. Leveraging our historical data set we devised a programmatic panel of more than 1,000 social accounts that have demonstrated a consistent ability to drive strong earned engagement and video views across a wide breadth of TV programs. SCR’s “Key Opinion Leaders” (KOL) panel is comprised of traditional and digital first media publications (ie. Variety, Hollywood Reporter, RapTV, etc.), TV journalists, and cultural influencers whose accounts across Twitter, Facebook, Instagram and YouTube drive mass engagement and video views for broadcast, cable and streaming programs. Our KOL panel augments our census-level Twitter organic measurement to deliver the most comprehensive earned measurement in the marketplace. Coupled with our best in market owned measurement SCR delivers the most comprehensive and trusted total owned and earned social measurement solution for media.
The following analysis details the impact of earned engagement and video views across the TV landscape. For the analysis we looked at 646 “active series” programs across TV that had KOL activity between January 1, 2023 to March 31, 2023. An “active series” is defined as a broadcast or cable program that aired at least one new episode or a streaming program that premiered between January and March. As the analysis details below, SCR’s Key Opinion Leader panel is imperative in understanding the true impact of social media on your TV programs.
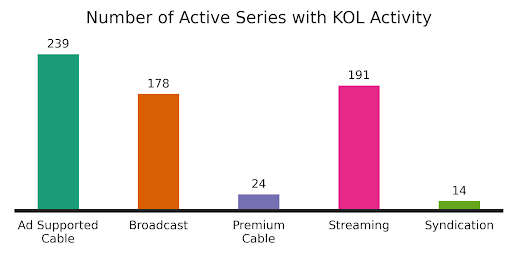
Distribution of Active Series with KOL Activity by Network Type
The below graph details the number of active in-season series by Network type that had any KOL activity over Q1 2023. The distribution of programs in this analysis is more or less split evenly between ad supported cable, broadcast, and streaming networks.
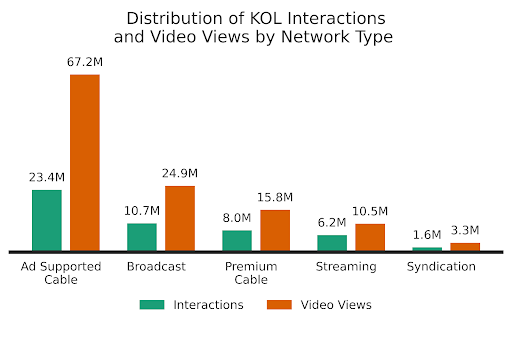
Distribution of KOL Interactions and Video Views by Network Type
Over the first quarter of 2023 SCR’s KOL panel generated more than 67,000 posts about the active series. These posts drove over 50MM interactions and 122MM video views for active series across all network types with Ad Supported Cable series receiving the highest levels of KOL interactions and video views. Even for network types that had different numbers of active series, KOL activity could look similar, as for example with Premium Cable and Streaming.
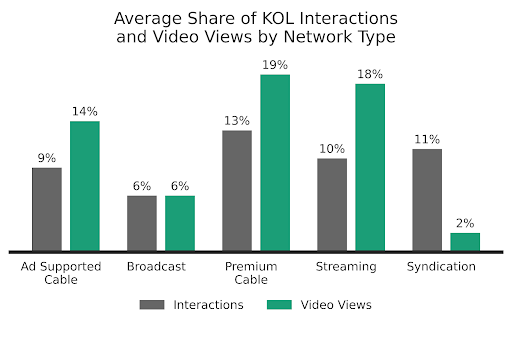
Average Share of KOL Interactions and Video Views by Network Type
Below we analyzed the share of KOL interactions and video views compared to the total interactions and views for the active series for each network type. On average KOL are driving somewhere between 6-13% of the total engagement and 2-19% of the total video views for in-season programs. Premium Cable and Streaming series tend to be on the higher end of the spectrum regarding what share of program activity comes from KOL. As seen above, while Ad Supported Cable garnered the highest amount of KOL interactions and views, Premium Cable series had the highest share on average of KOL interactions and views with 13% of their total interactions and 19% of their video views.
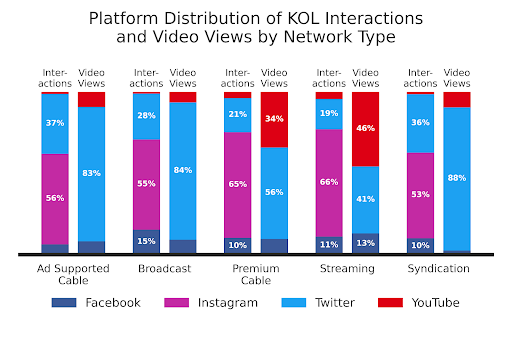
Platform Distribution of KOL Interactions and Video Views by Network Type
Here we break down the distribution of interactions and video views by platform for each network type. While the distribution of interactions is fairly standard across all network types with Instagram driving the most interactions, video views are more variable. For Ad Supported Cable and Broadcast, Twitter is by far the most impactful in generating KOL-driven video views for their active series while KOL accounts on YouTube drove significantly more video views for Premium Cable and Streaming series.
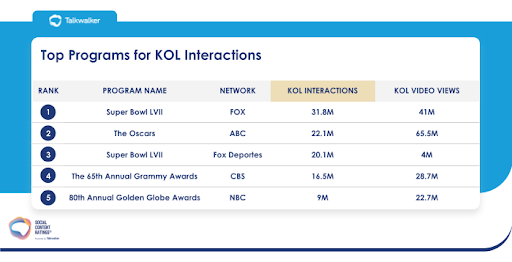
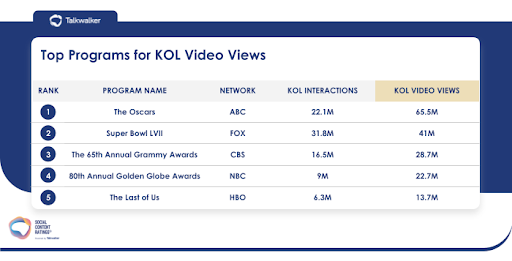
Top 5 Programs by KOL Interactions and Video Views
(Series, Specials and Sports Events)
As detailed above KOL drive a significant share of total interactions and video views for active series, but they also drive massive engagement and viewing for Specials and Sports Events as well. SCR’s KOL panel generated the most interactions for The Super Bowl LVII on Fox with close to 32MM interactions (30% of the game’s total interactions) and for video views KOL generated more than 65MM for the Oscars (71% of their total video views).
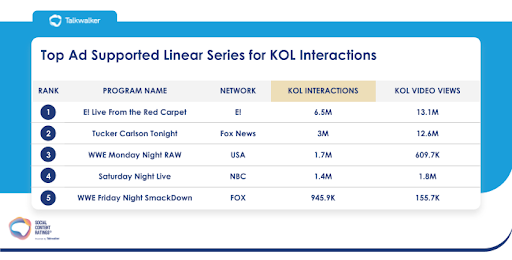
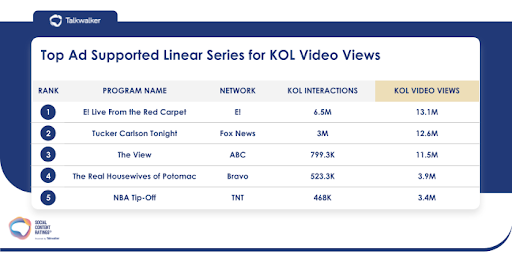
Top 5 Ad Supported Linear Series Programs by KOL Interactions and Video Views
For Ad Supported Linear Series E! Live from the Red Carpet ranked 1st with 6.5MM KOL interactions followed by Fox News’ now-canceled Tucker Carlson Tonight, WWE Monday Night Raw and NBC’s SNL. For KOL video views E! Live from the Red Carpet and Tucker Carlson Tonight also garnered the most KOL video views and were followed by ABC’s The View, Bravo’s The Real Housewives of the Potomac and TNT’s NBA Tip-Off.
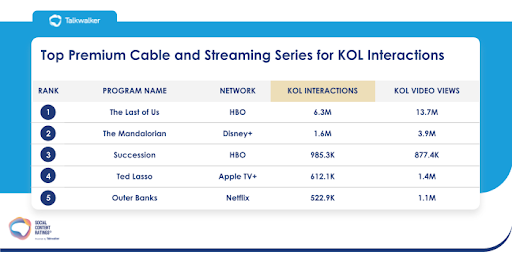
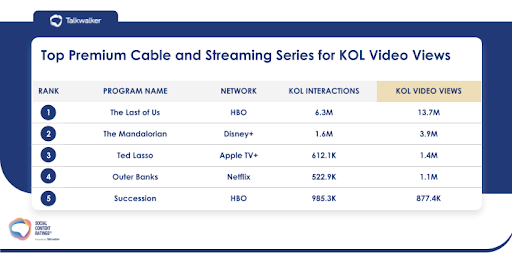
Top 5 Streaming and Premium Cable Series Programs by KOL Interactions and Video Views
Our Key Opinion Leader panel drove significant interactions and video views for some of the most popular Premium Cable and Streaming series. HBO’s The Last of Us received the most engagement from our KOL with 6.3MM interactions (14% of their total) and 13.7MM video views (32% of their total). Disney+’s The Mandalorian, HBO’s Succession, Apple TV+’s Ted Lasso and Netflix’s Outer Banks also received outsized KOL interactions and video views as well.
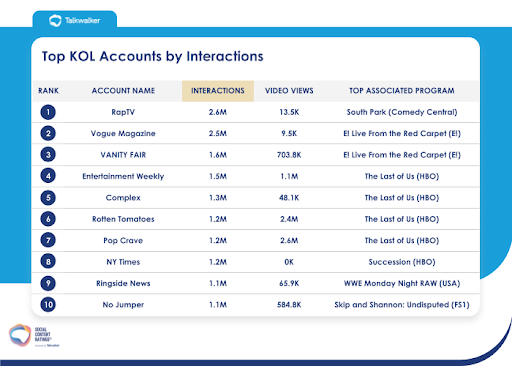
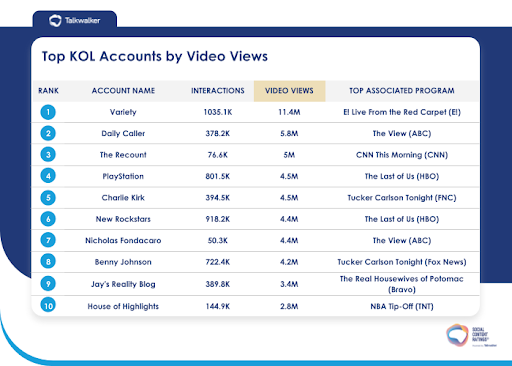
Top 10 KOL Accounts by Interactions & Video Views
As detailed above SCR’s 1000 account KOL panel drove massive interactions and video views for a wide variety of TV programs across all network types. But what KOL accounts drove the most engagement and views across all of in-season TV for Q1 2023? From the lists below you can see that singular Key Opinion Leader accounts can garner significant social engagement and video views for TV programming with their followership. From traditional publications like Vogue Magazine, Variety, and Vanity Fair to digital-first, pop culture and sports publishers like RapTV and House of Highlights, to political activist influencers like Nicholas Fondacara and Charlie Kirk, massive engagement and video views with TV programming is coming from these influential accounts.
In summary, Talkwalker’s SCR Key Opinion Leader panel provides programmers a unique ability to better quantify, understand and gain insights from the most influential accounts across platforms that are driving earned buzz for television programs. This new visibility allows networks to identify and target those influencers that talk about their programing and create further marketing opportunities for the network's social teams. With Talkwalker’s SCR KOL measurement solution the earned impact social is having on TV programs has never been clearer.