
Social Media Reporting
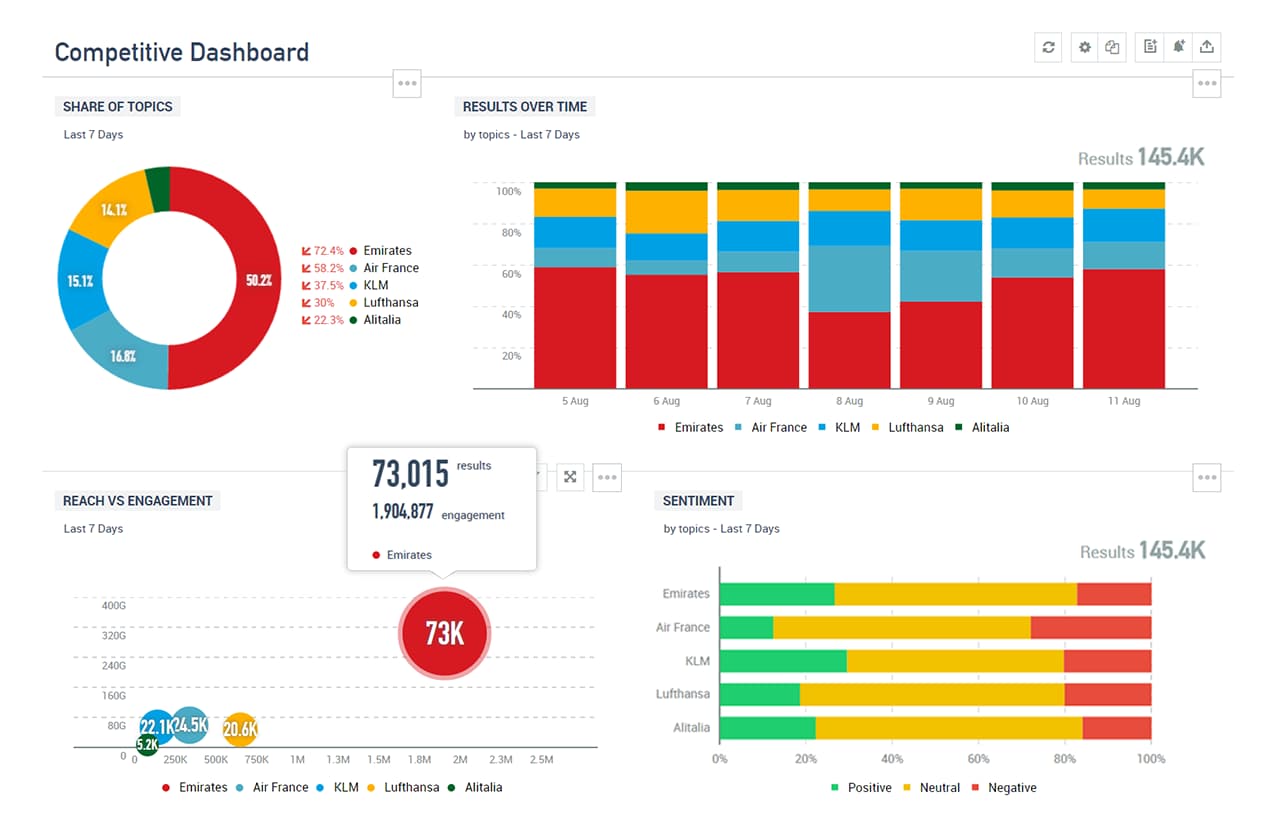
Use automated reporting functions to share social intelligence across departments in seconds.
Step 1 of 2
Fill out the form to get your personal demo from our social experts
* indicates required fields
Save Time
Save time spent manually preparing and formatting social KPI reports using customizable, multi-format reporting functions.
- Bring reports to life by including video and images, adding comments and editing reports from within the platform.
- Easily download reports as PowerPoint, Word or PDF with underlying data attached to showcase social results to management.
Prove Value
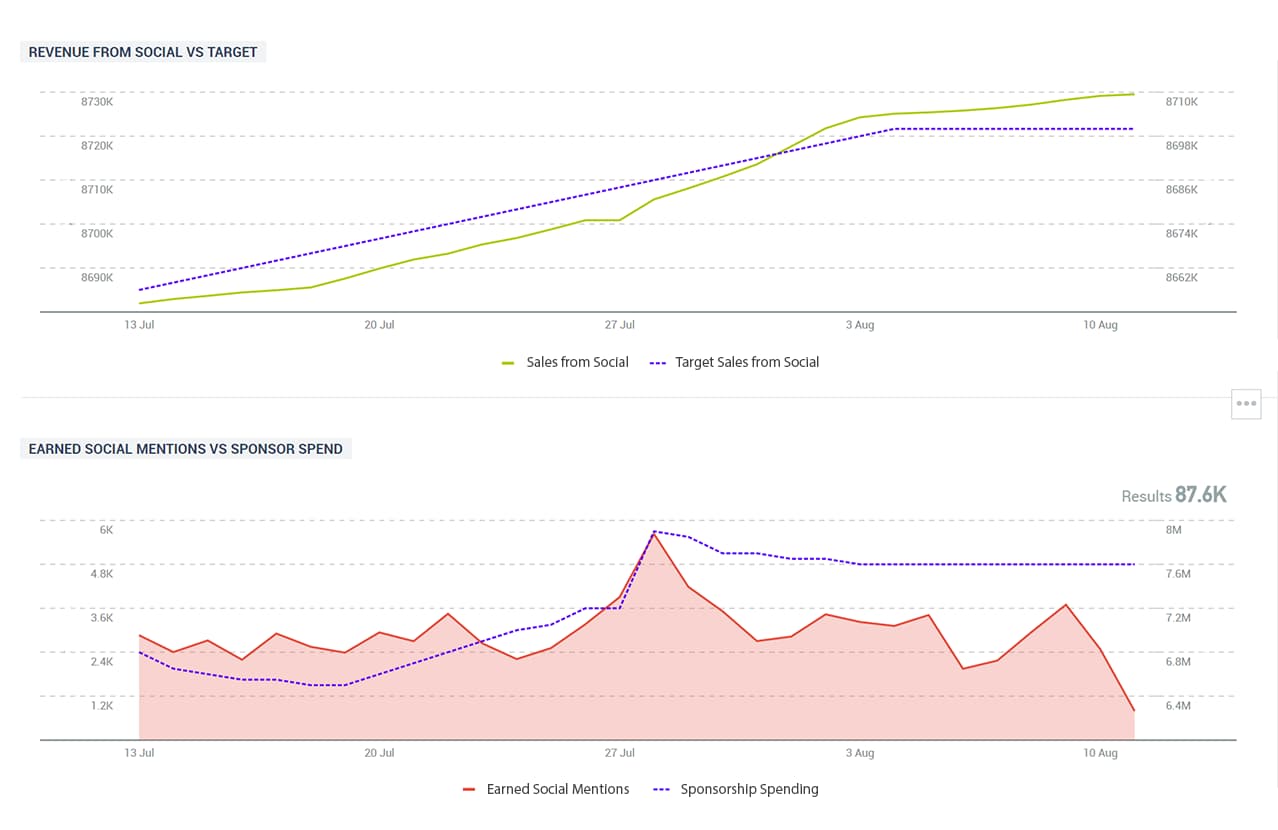
Demonstrate the value of marketing campaigns by backing up results with multiple data sets.
- Quickly export data to Excel, CSV and RSS format to perform advanced analysis.
- Easily integrate Talkwalker social data into your CRM system, BI tools or common statistical tools to manipulate it efficiently.
- Combine social data with lead gen stats or revenue numbers to prove ROI.
Raise Awareness
Highlight success by sharing easy-to-understand reports that meet each department's needs.
- Add custom data to link social data to key indicators for each business function.
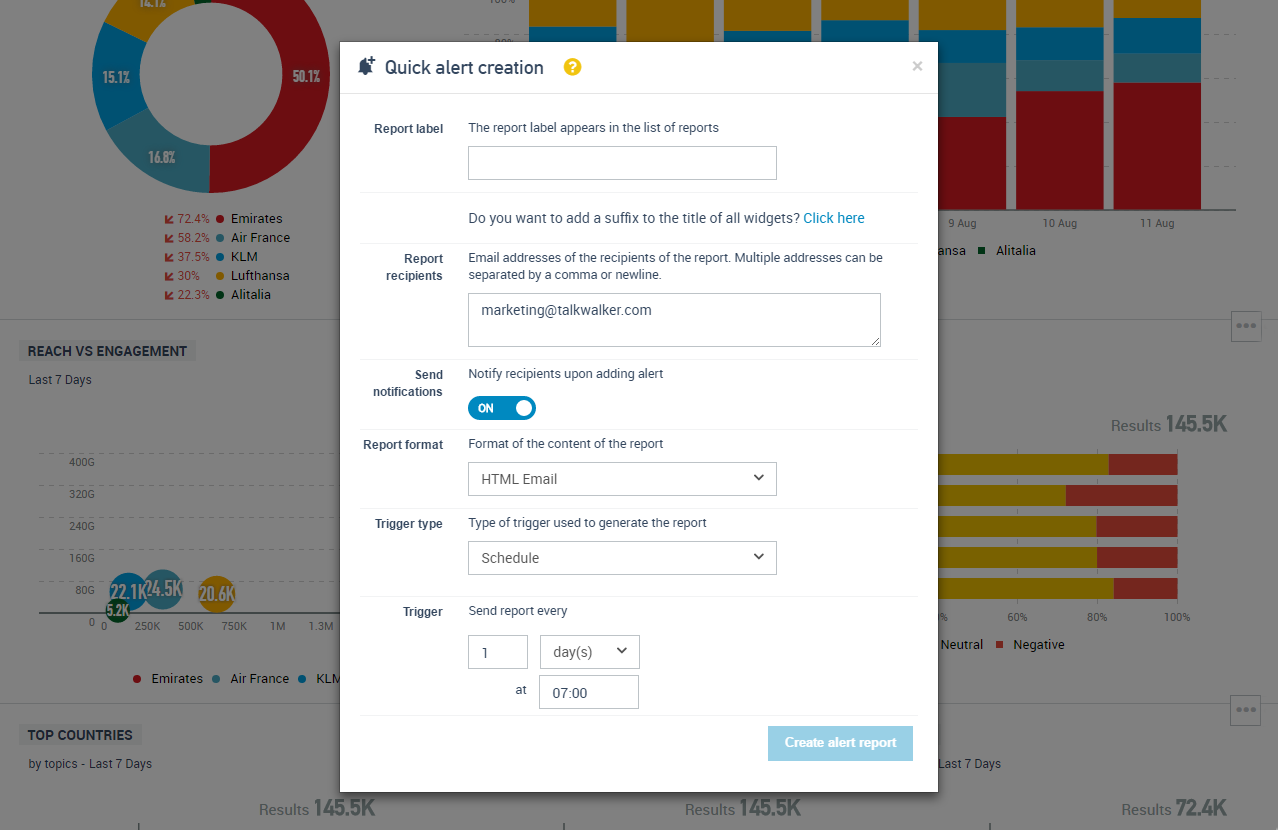
- Configure alerts and newsletters so that you and your colleagues receive a specific report by email without even needing to log into the tool.
- Receive automatic updates of dashboards each time they are accessed, downloaded or emailed.
- Schedule reports to every key stakeholder with one click.