
Consumer intelligence
How to use social listening for consumer insights in 2026
Learn how social listening delivers real-time consumer insights that surveys miss — and how to track sentiment, trends, and demographics in Talkwalker.
April 28, 2026

When it comes to consumer insights, surveys and panels are excellent at validating known behaviors. They’re also slow, episodic, retrospective, susceptible to several types of bias, and their sample size is often limited by your budget.
Social listening, on the other hand, offers continuous access to unprompted, spontaneous behavior and opinions at scale.
In this post, we’ll dig into how social listening strengthens your consumer intelligence, and then show you how to create a Talkwalker report that answers your business’s most burning questions.
Key takeaways
Social listening’s real-time, unprompted data fills in the insight gaps of traditional research methods
Social listening is applicable across industries, answering strategic questions for teams across marketing, leadership, product development and customer experience.
Setting up a solid social listening dashboard doesn’t require expertise, just a solid sense of what you’re listening for.
To turn social data into insight, focus on sentiment, demographics, and emerging trends.
Operationalize your insights with scheduled reports and real-time alerts.
Why social intelligence beats surveys for consumer insights
Don’t get us wrong, social listening won’t replace traditional research. However, listening can strengthen your research by identifying where to focus, what to test, and how to frame hypotheses.
Social listening excels in a few key areas:
1. Continuous, real-time data
By continually monitoring relevant conversations on social, a tool like Talkwalker measures momentum and velocity, not just static snapshots. You can track:
how fast a trend is growing,
whether it’s peaking or declining,
and how it spreads across regions or audiences.
2. Spontaneous, unfiltered expression
Even the best survey design relies on recall and self-reporting: framing bias, social desirability bias, and survivorship bias all affect your results.
Social listening, however, catches your audience’s behavior as it happens, meaning you see actual habits in real time, not reconstructions of the past.
3. Early signal detection
Surveys report on averages, which can flatten subtle patterns and outright dismiss outliers.
With social listening, you can identify niche subcultures and fringe use cases before they become mainstream. Seeing edge cases before they become the norm puts you ahead of the next trend.
4. Cultural context and meaning
Social media offers rich, specific, emotional examples of what people are saying. Rather than an abstract 1-10 satisfaction rating, you can uncover meaning through:
customer language (“treat,” “guilty pleasure,” “clean snacks”)
emotional framing (comfort, reward, boredom)
adjacent trends (wellness, budgeting, indulgence cycles)
insight into how your product is influencing wider culture (memes, challenges, etc.)
Seeing how your customers complain about or hack your product can reveal unmet needs and actionable product and positioning gaps.
5. Scale of data
Social listening analyzes millions of global, longitudinal data points and captures diversity across regions and demographics. Surveys inherently need to limit samples and questions, but starting broad allows patterns to emerge without predetermined constraints.
Where does social listening fit across industries?
In analyzing the data behind our What Snackers Want report, the ubiquity of snacks in life and culture made for big volume and rich discovery. But sensing rising themes and brewing sentiment is not unique to CPG; it’s a capability useful to any business that serves customers.
Brand-forward businesses in retail, hospitality, SaaS, and entertainment use social listening to identify rising product categories or aesthetics, understand demand spikes or shifting sentiment, and improve friction points. In fast-moving categories, listening provides the ability to act on signals while they are still forming, rather than after they are widely adopted.
Regulated industries can also leverage social data, with appropriate guardrails. Finserv companies get insight into consumer anxiety, trust and spending mindsets that govern emerging behaviors (e.g., saving, investing, budgeting). Healthcare organizations gain early insight into patient experience that supports formal clinical research.
What kinds of questions can social listening answer?
Social listening isn’t just for your social media team. It can provide insight into heady strategic questions that keep your C-suite awake at night, or give a quick temperature check to validate a marketing choice. Here are the questions we’ve seen different teams ask:
Product development questions, like:
How are our customers actually using our product?
How are consumers combining or modifying products?
What are consumers trying to solve?
What feedback emerges after product launches?
What small changes could significantly improve experience?
What product attributes are consistently criticized?
Which ideas are already “validated” by organic behavior?
What white spaces exist that no brand is addressing?
Marketing questions, like:
What words and language are our customers using?
How are people reacting to our launch or campaign?
How does this trend change across regions and audiences?
What does this trend, category or product mean right now?
Which brands are gaining attention or losing relevance?
Customer experience and support questions, like:
What issues are customers publicly complaining about?
Are there recurring service or delivery frustrations?
Where in the experience do breakdowns happen?
What moments generate delight vs. frustration?
Are there spikes in negative sentiment that need intervention?
What issues are escalating in real time?
Broader strategy and leadership questions, like:
How is the category evolving culturally and behaviorally?
What macro trends (health, economy, lifestyle) are reshaping demand?
Where are the biggest unmet needs or white spaces?
What early signals could become major growth areas?
Are there reputational or product risks forming?
Are consumers trading up, trading down, or switching categories?
How to track consumer insights in Talkwalker
Let’s walk through how to set up and interpret your own report in Talkwalker. You don’t need to be an expert to start; you just need to know what you’re listening for.
Step 1: Define what you’re tracking and set up your search
First, set up a new project in Talkwalker. A project is the main organizational container, and you can think of it as a research brief, holding all the topics, channels and analytics you’ll use.
Go to the Projects section in Account Settings.
Click the + New Project button at the top of the page.
Enter a name for your project.
Click Create new project.
Next, build out your topics. This is where you set up each search that Talkwalker will run and monitor for you. In your Project Settings, navigate to Topics and click on +New Topic in the top left.
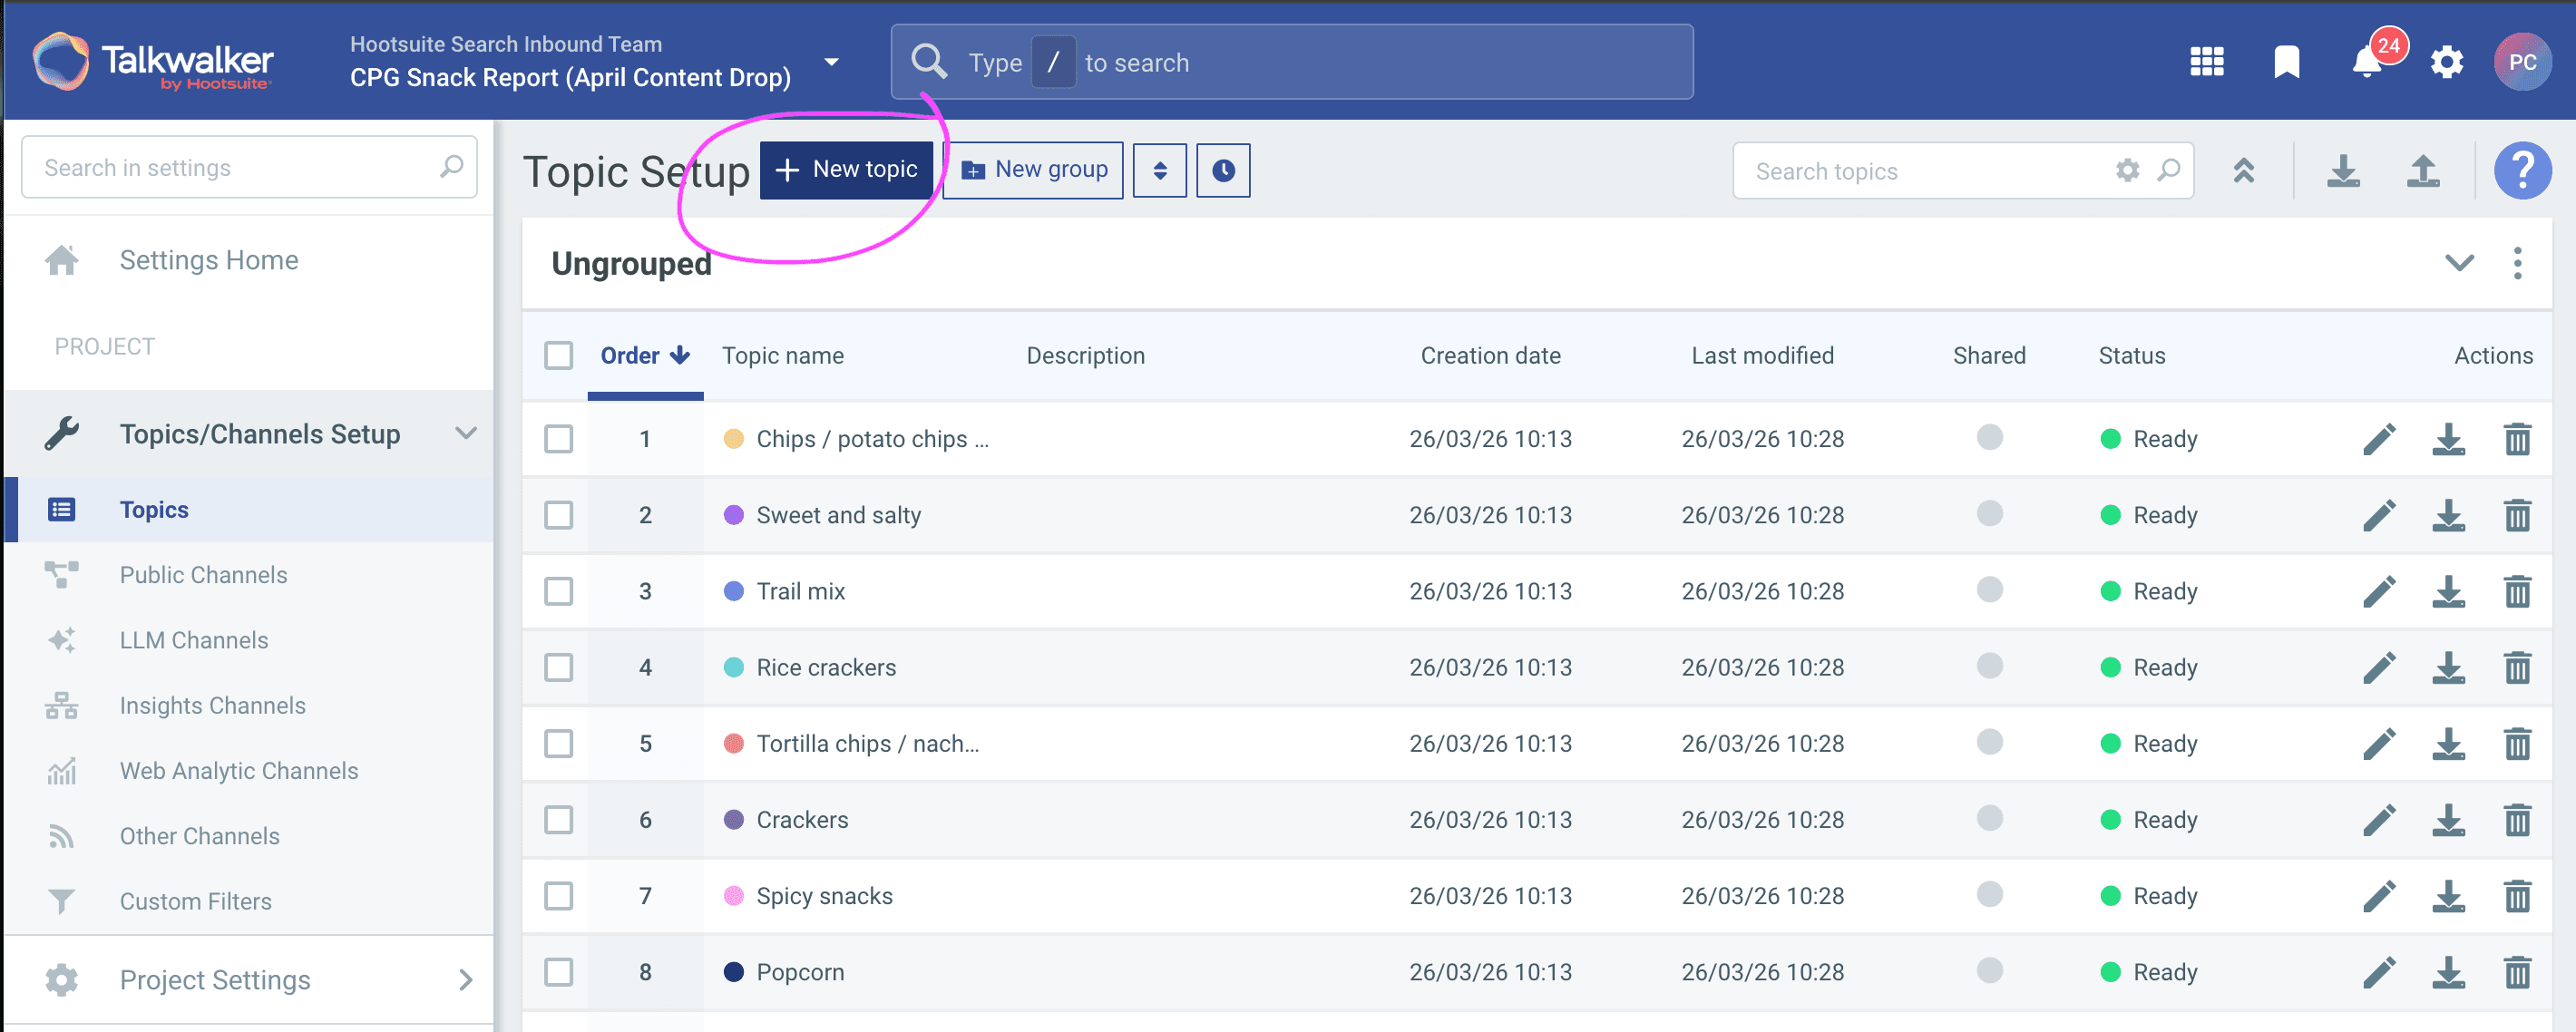
There are three ways to set up a new topic for social listening.
First, you can enter your keywords manually using Boolean operators. This is the most precise option for teams who have a clear sense of their category and are comfortable using (or learning) Boolean operators.
This approach gives you maximum control over what gets collected and what gets filtered out. If you haven’t done this before, we highly recommend perusing our post on how to write a perfect social listening query.
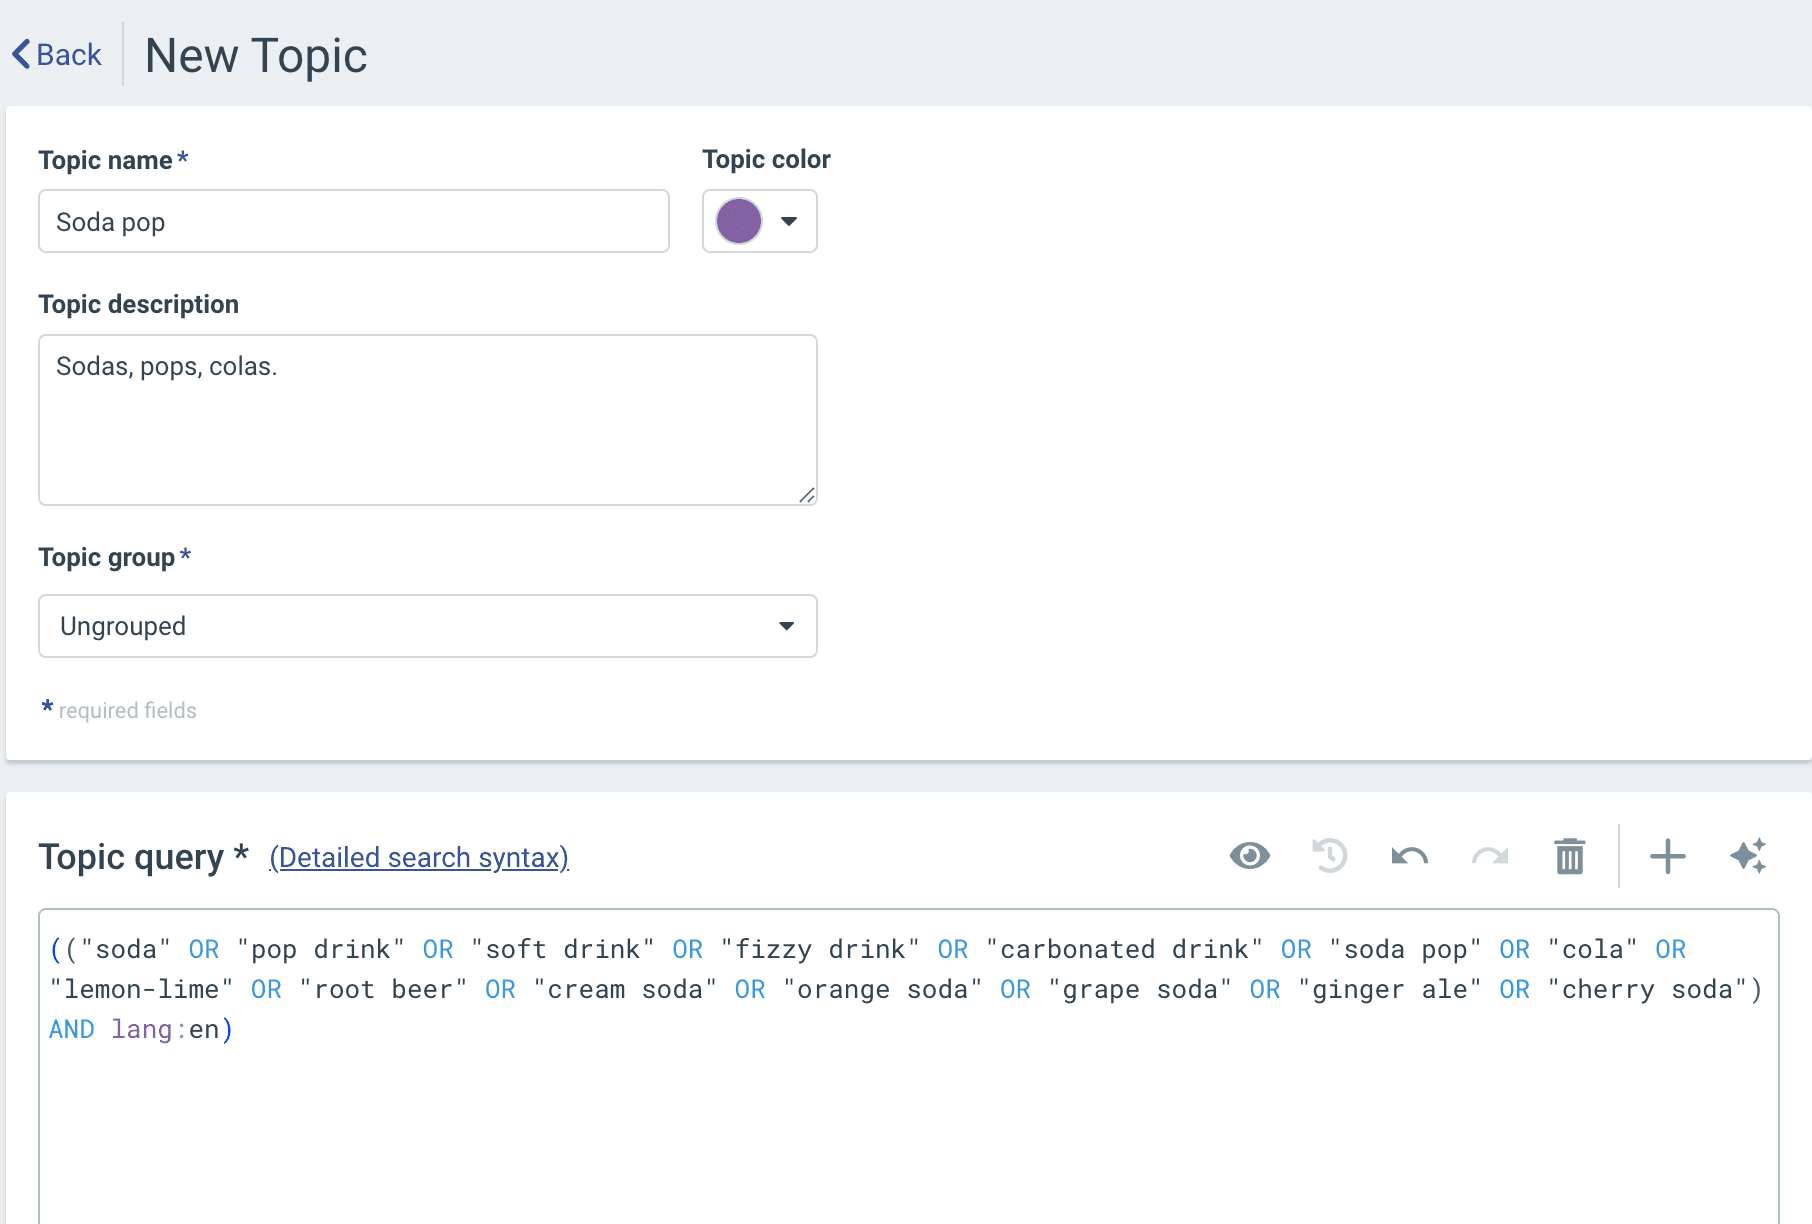
You’ll also need to define your exclusions. When we ran the analysis behind our What Snackers Want report, we had to manually exclude terms like "computer chips," "chocolate chips," “fish and chips,” "nuts and bolts," and references to a Spanish footballer named Nacho. Without those exclusions, the data would have been polluted with irrelevant results.
Before you launch a topic, spend time thinking through the edge cases in your category. The cleaner your query, the more useful everything downstream will be.
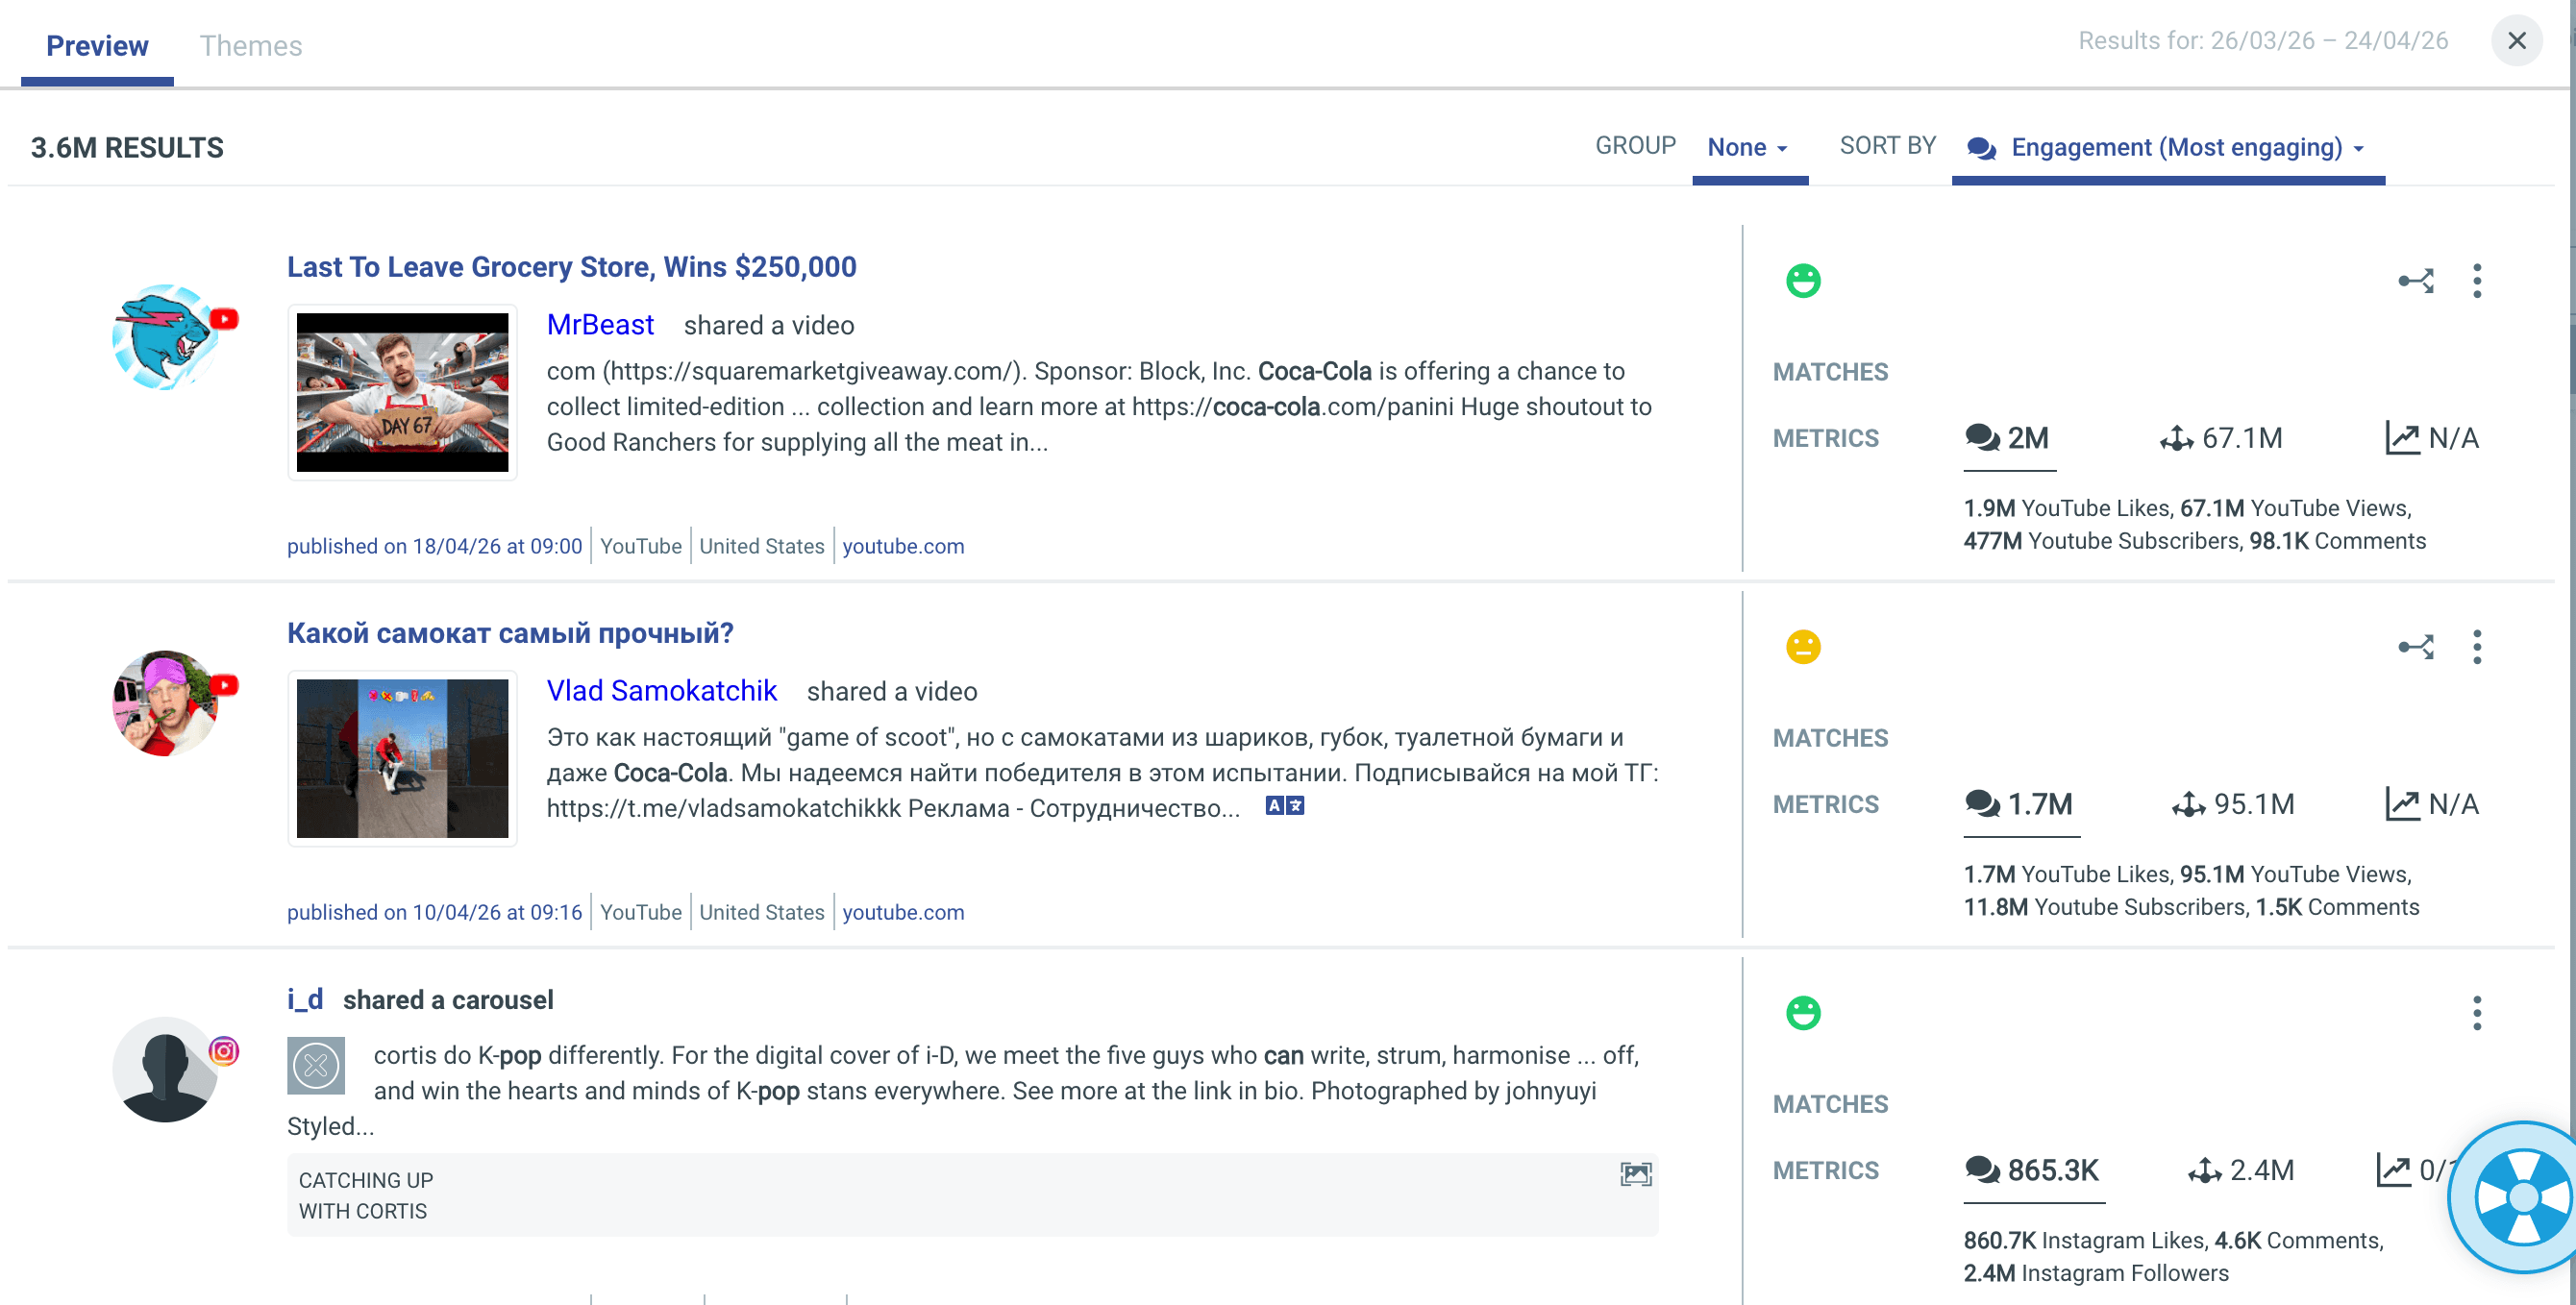
Pro tip: At any time, you can click the Preview Line button to get a glimpse of what kind of content your query will surface. This is a quick way to iterate and identify exclusions. (e.g., if K-pop posts are showing up in your soda query, exclude “K-pop”.)
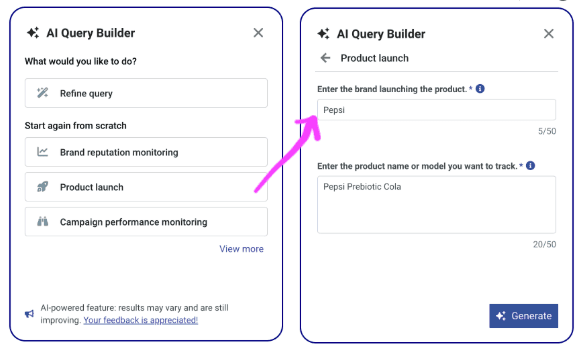
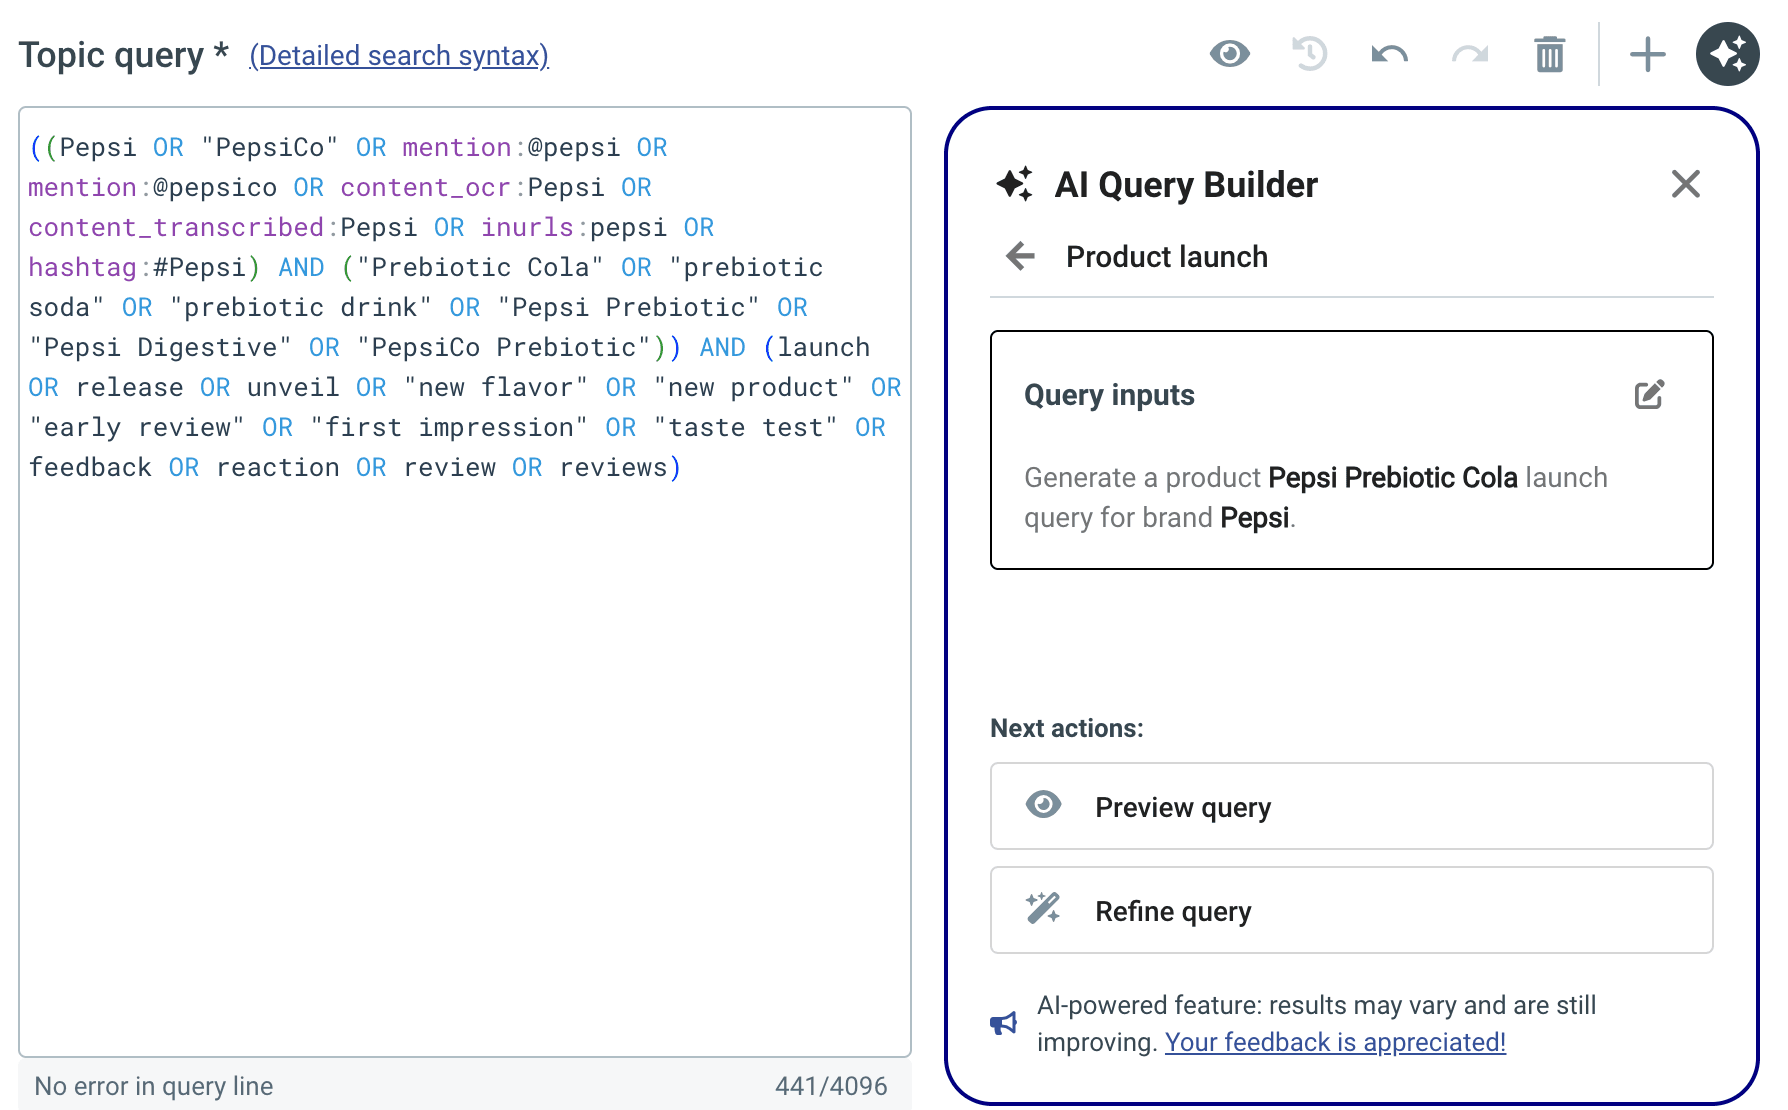
The second option is using the AI Query Builder, which is a lifesaver if you’re working in a complex category with a lot of noise, or if Boolean operators are just overwhelming. Even if you’re a search expert, you can use the AI to refine your query.
The AI Query Builder also offers options for the type of monitoring you’re looking to do (e.g., ongoing reputation monitoring, a product launch or a campaign), and the AI will prompt you for the necessary details before building your query out.
The third way to build a topic is by importing from a list. This is useful for large-scale setups or when migrating existing tracking to Talkwalker. You can import topics via CSV, XLS, or XLSX files, as long as the format matches Talkwalker's query syntax.
To summarize: set up your project first, then build topics within it. Use Boolean queries for precision, the AI Query Builder for speed, or import from a list for scale. Exclusions aren’t optional, they’re a key part of getting valid results.
Step 2: Understand how your audience feels with sentiment analysis
Now we’re ready to start looking at the data. While the most obvious metric, volume of results, tells you which topics are getting attention, sentiment tells you how people feel about those topics. So when you see a spike in mentions on Monday morning, sentiment is how you tell the difference between a viral product launch and a viral complaint thread.
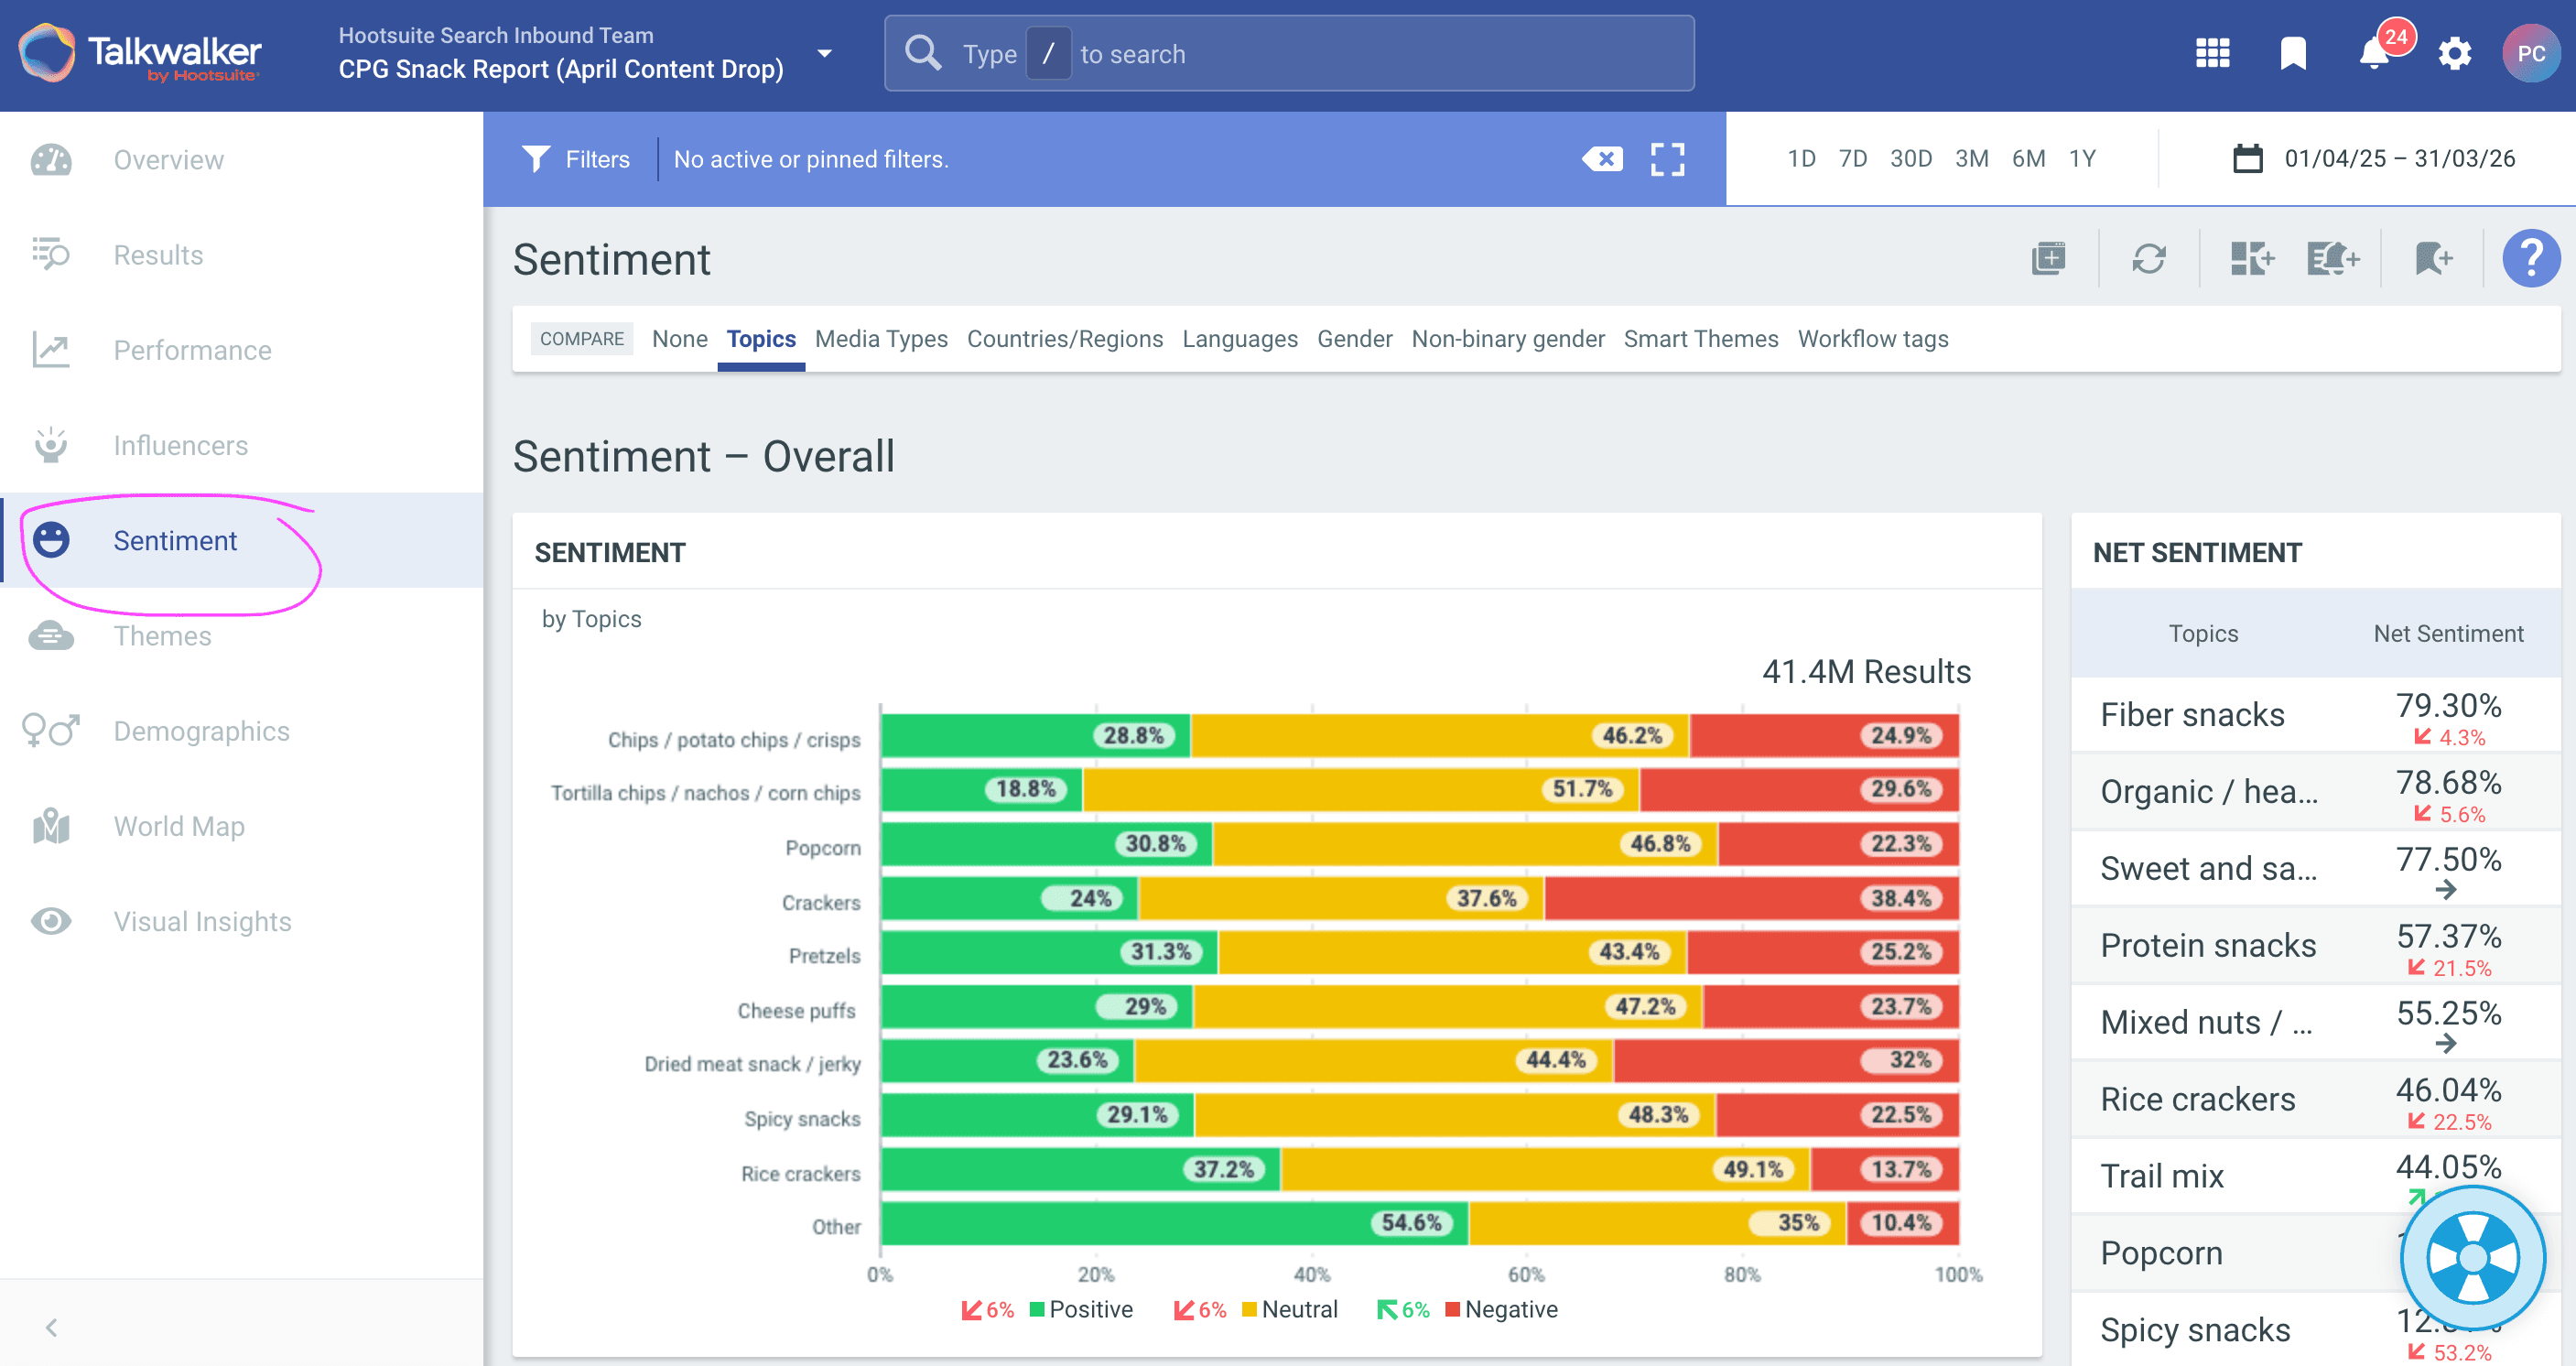
For example, in our What Snackers Want report, tortilla chips and crackers had very similar volume, but crackers had 38% negative posts, whereas tortilla chips hovered at 29%. Digging into sentiment revealed that crackers were suffering from consumer concerns about ultra-processing and misleading health claims, whereas tortillas had experienced a positive swell around the Super Bowl.
To get a general overview of sentiment, go to Topic Analytics, select your topic(s), and go to the sentiment tab in the sidebar. In the tabs along the top, you’re able to slice topic, region, language and gender by sentiment. You can also see sentiment over time and key drivers.
Talkwalker automatically assigns positive, neutral, or negative classification to every result, with a 90% accuracy rate that is actually pretty good at detecting humor and sarcasm. You’re able to override it manually when necessary, of course.
If you need more granularity — say, distinguishing between price-related frustration and an ingredient-related concern, or separating genuine product praise from sarcastic engagement — AI Classifiers allow you to train custom sentiment models on top of the standard three categories.
To sum up, sentiment analysis is automatic once enabled and, when combined with volume data, turns a mention count into a high-level read on consumer opinion.
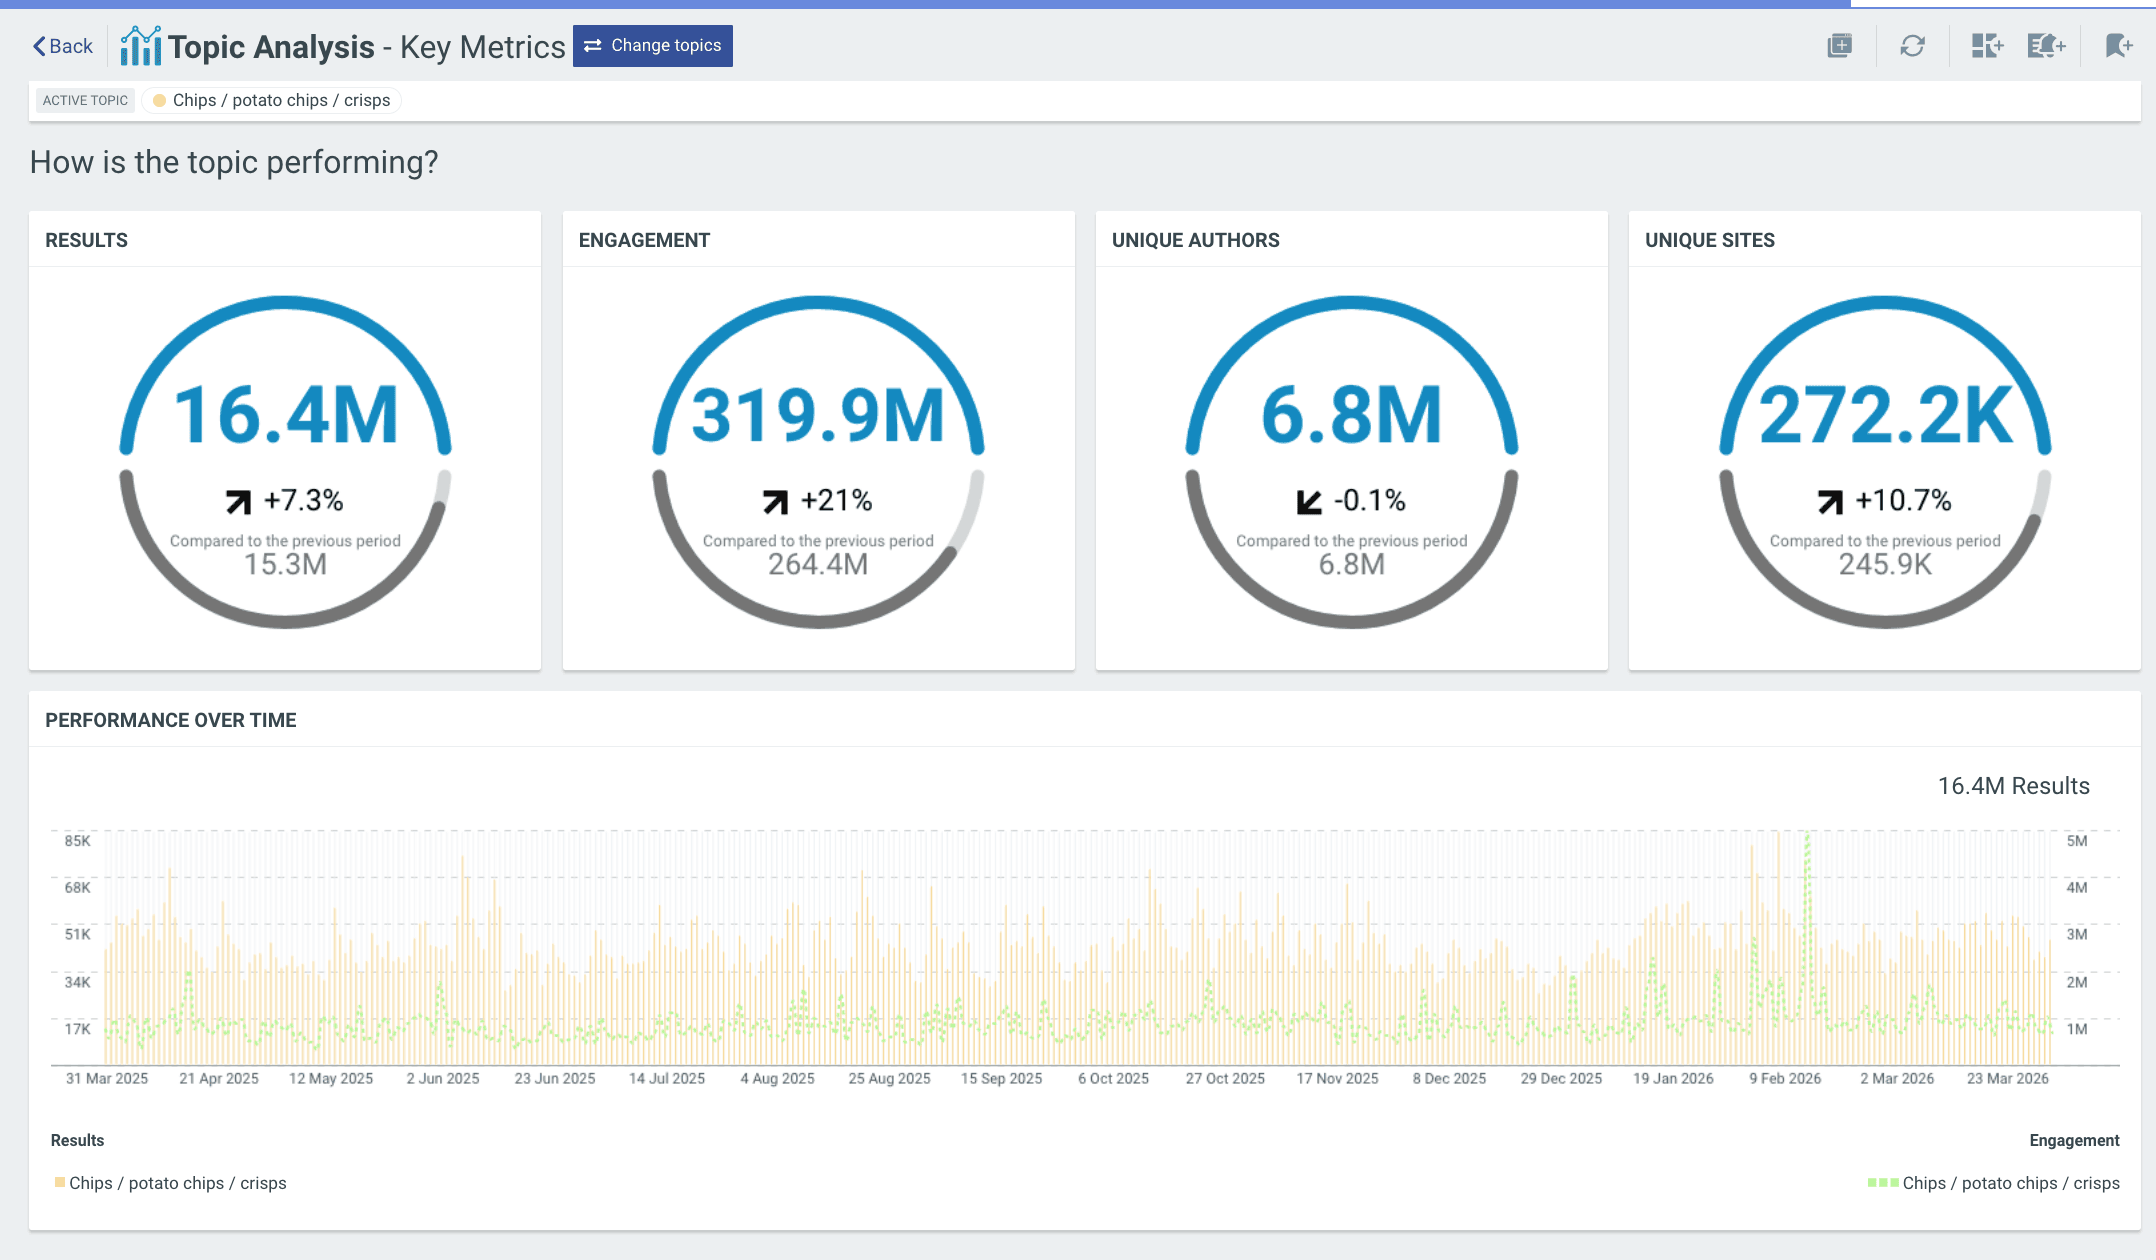
Step 3: Spot rising and declining trends
Questions about trends are generally strategic or immediate: is the category growing, stalling or contracting? Or is something unusual happening right now that I need to know about? Talkwalker has dedicated tools for both.
Trend Analysis IQ is a dedicated strategic view that you can access through the IQ Apps section of your project. Click Launch IQ app, and select the topics you want to analyze. You’ll get a suite of visualizations showing the evolution of popularity over time. First, we get a bubble graph visualizing the evolution of popularity over time, which easily identifies trends when viewed as a time-lapse.
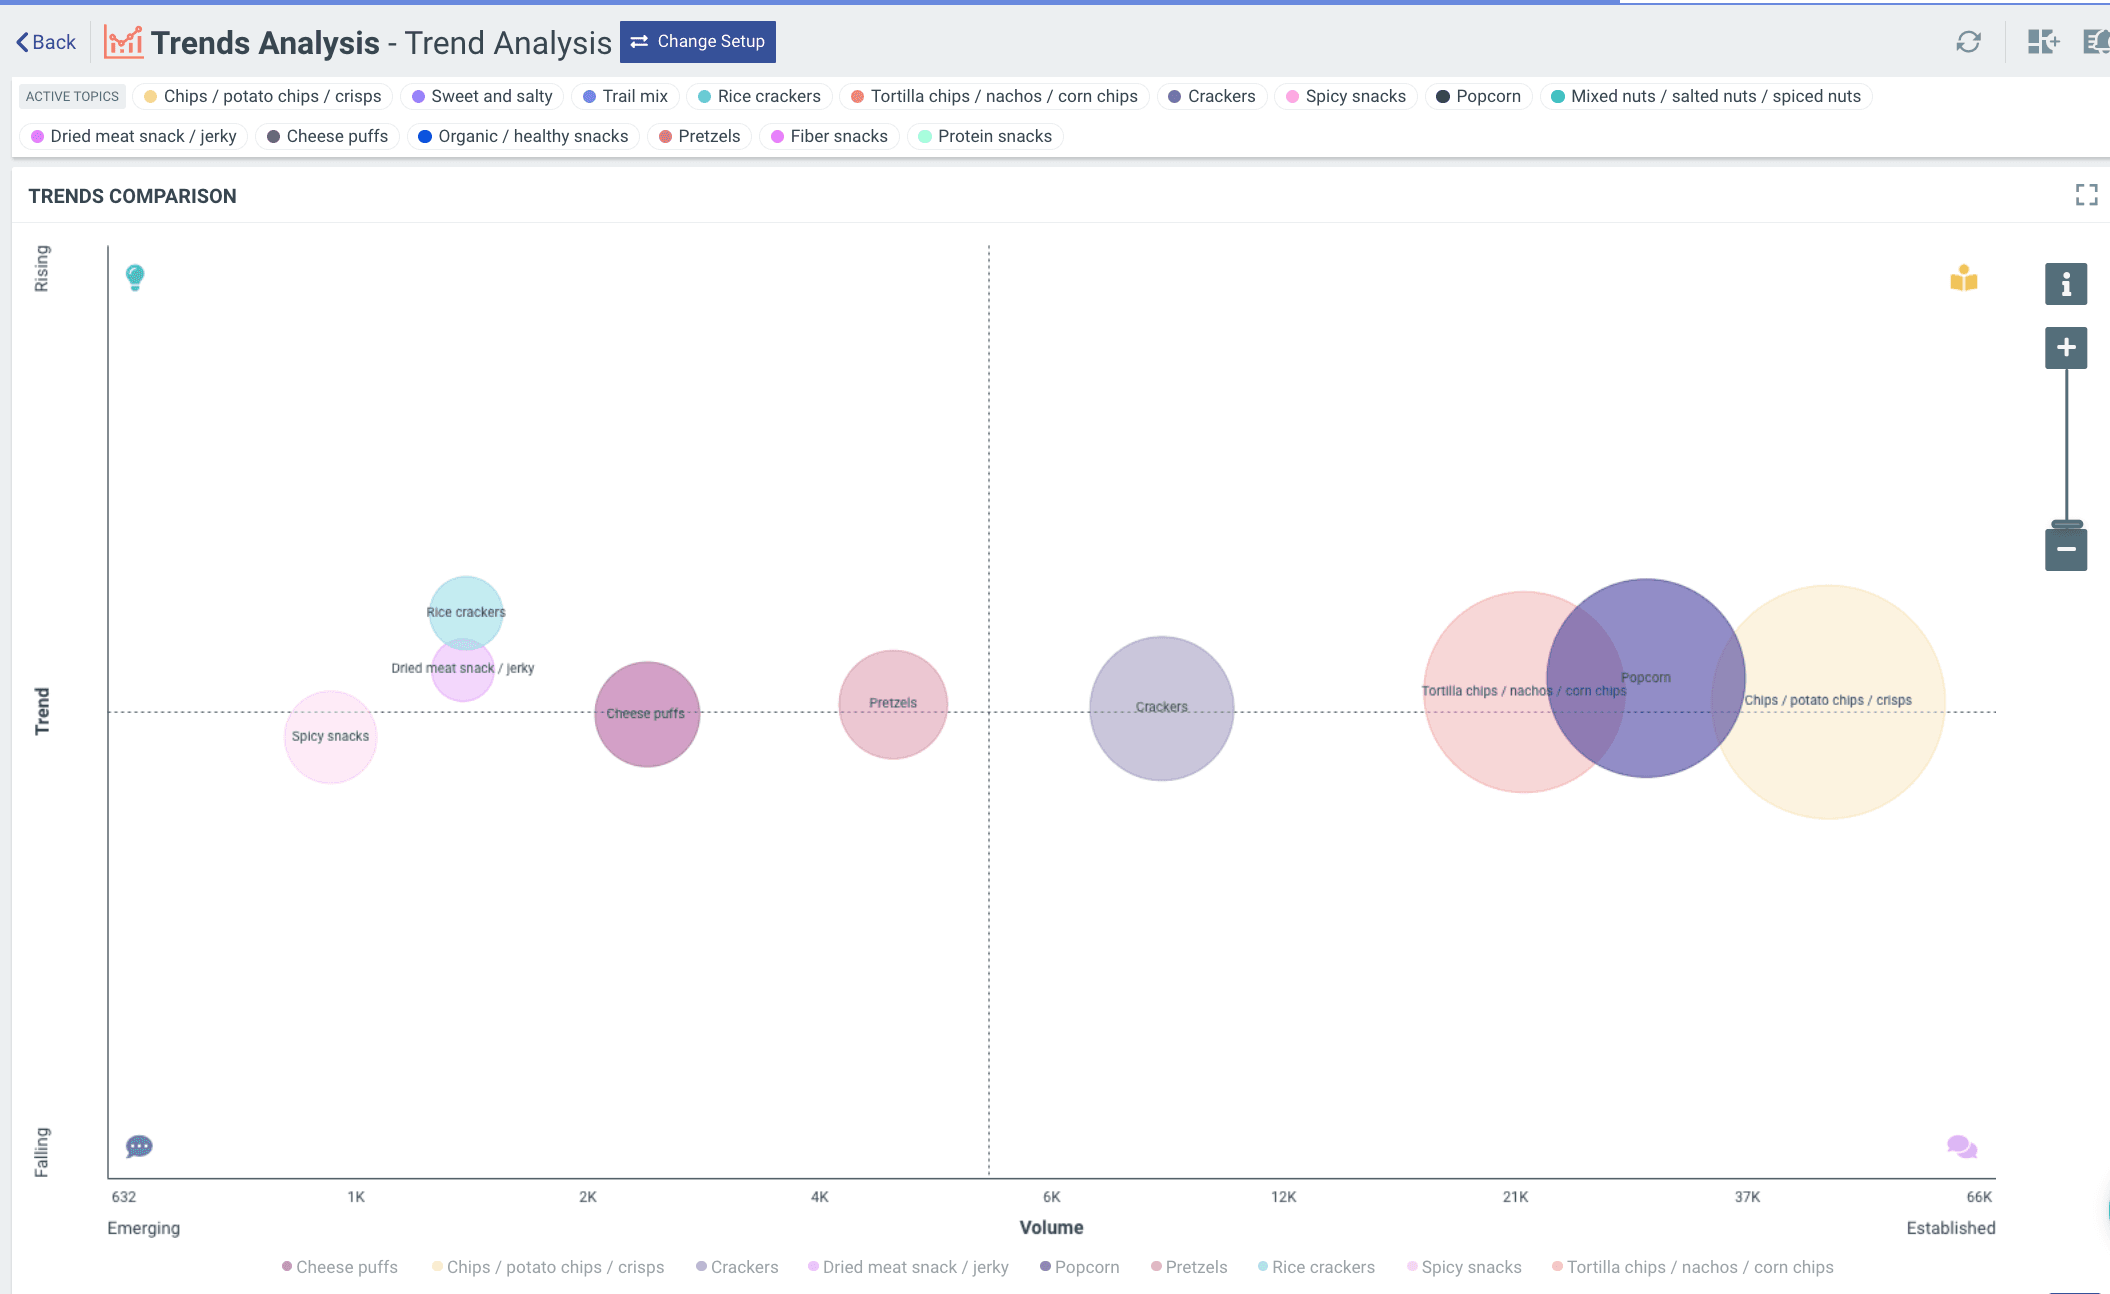
Second, you’ll also be able to break down the trend for each selected topic into segments and annotated changepoints (that is, a point in time when volume increases or decreases suddenly).
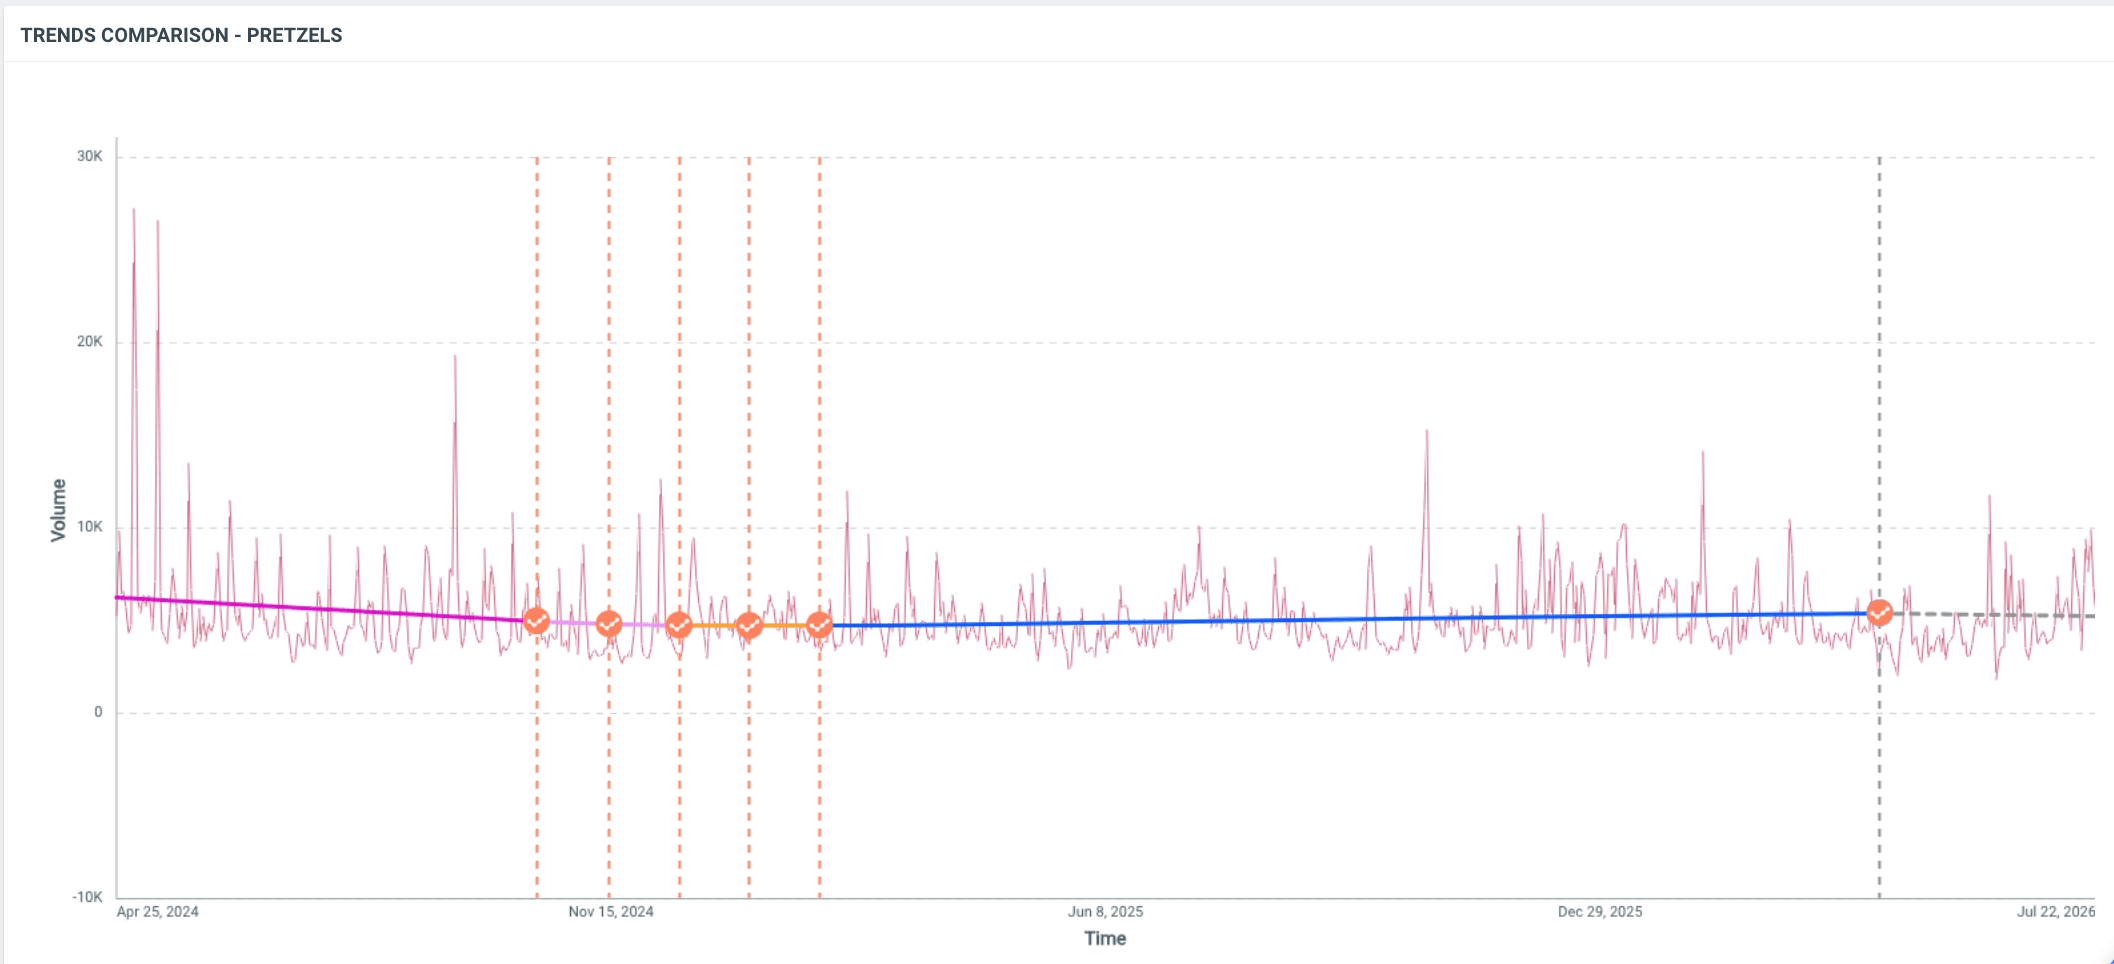
Peak Detection and Smart Spike, on the other hand, detect anomalies in post volume so that you know when something significant is happening. Smart Spike will alert you in real time, whereas Peak Detection provides context such as date, topic, result count and engagement over time, which is very useful for reporting. (Peak detection can be enabled on any over-time graph by clicking the three dots in the upper right of a graph.)
In short: Use the Trend Analysis IQ App for strategic trend work and forecasting. Use Smart Spike and Peak Detection for real-time anomaly detection. Together, these tools cover both the long view and the immediate moment.
Step 4: Uncover demographic insights about your audience
Now that we understand what people are saying, let’s dig into who’s saying it.
Talkwalker automatically infers demographics from publicly available author metadata, for instance, profile information, language, location tags, and other signals. It will report on:
Age group
Gender
Location (country, city, and region)
Profession and occupation (platform-dependent)
Interests and hobbies (platform-dependent)
Language
You can find this information in the demographics tab of Topic Analytics.
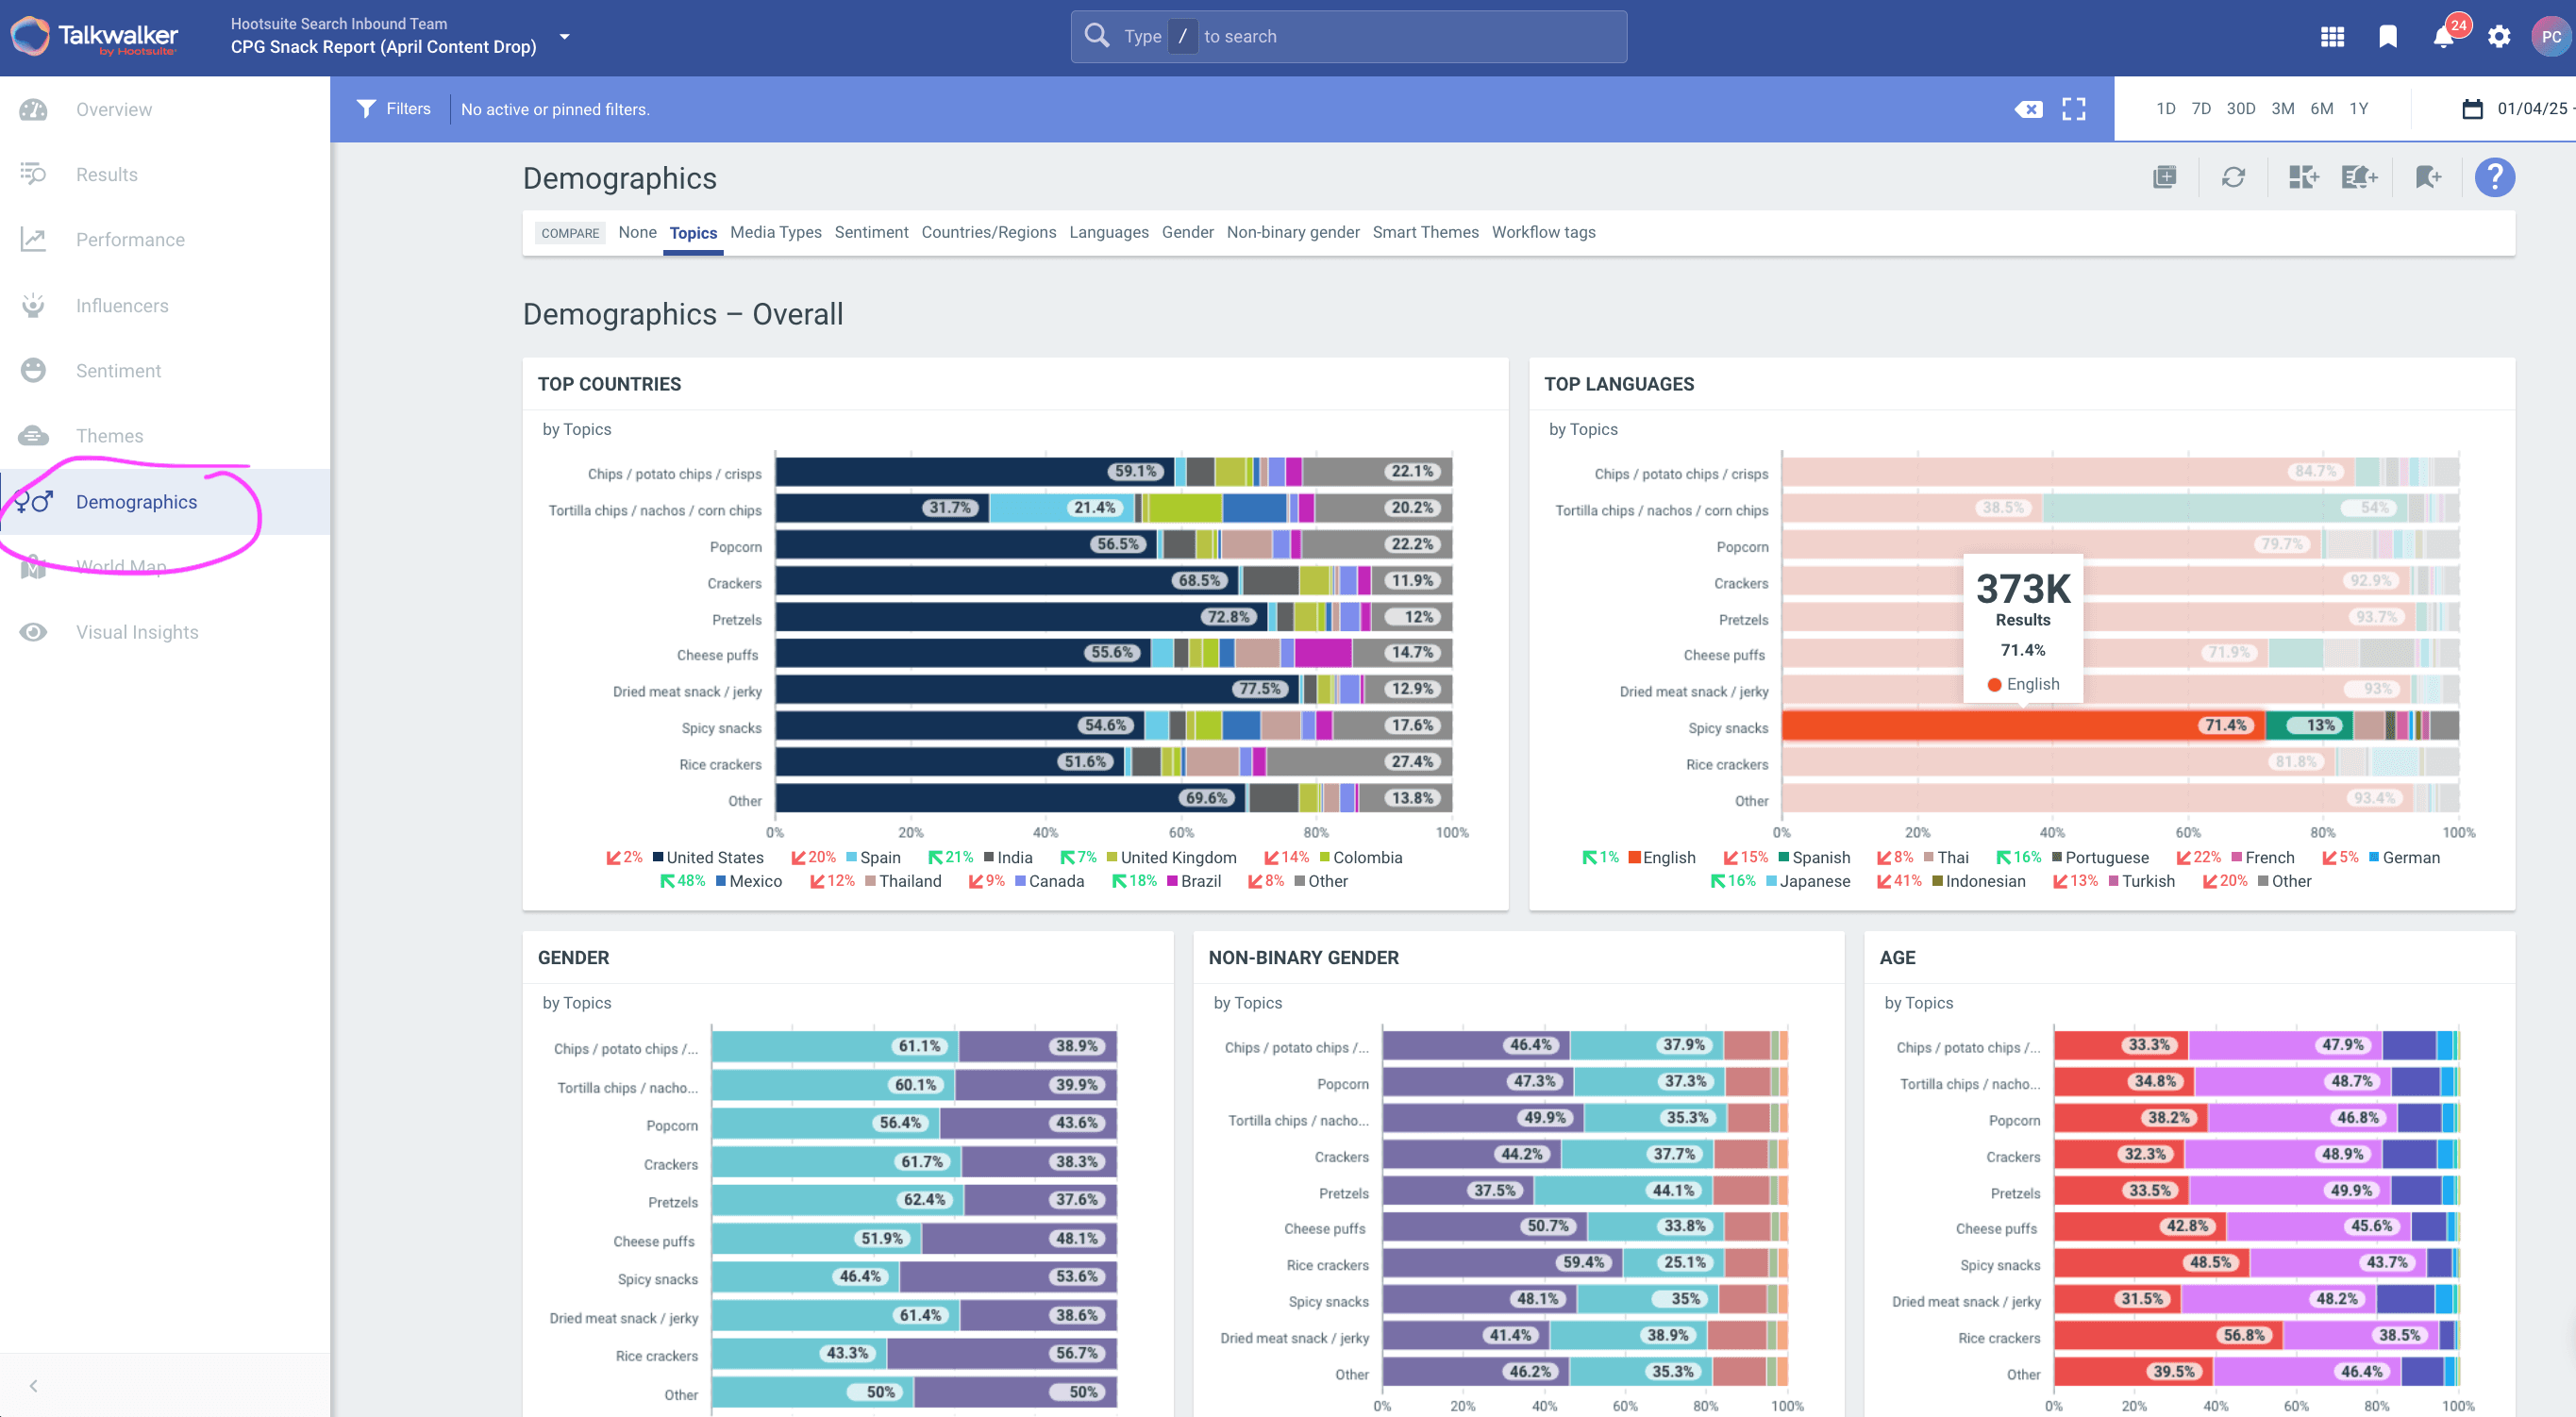
Caveat: Not every result has demographic data, and not all dimensions are available for all platforms, so totals for demographic categories may differ from the overall results count. These are directional signals, not census data.
Step 5: Track how AI is influencing your category
Social listening captures what people say about your brand, but there's now a second layer of perception that operates independently of what consumers post: what LLMs say.
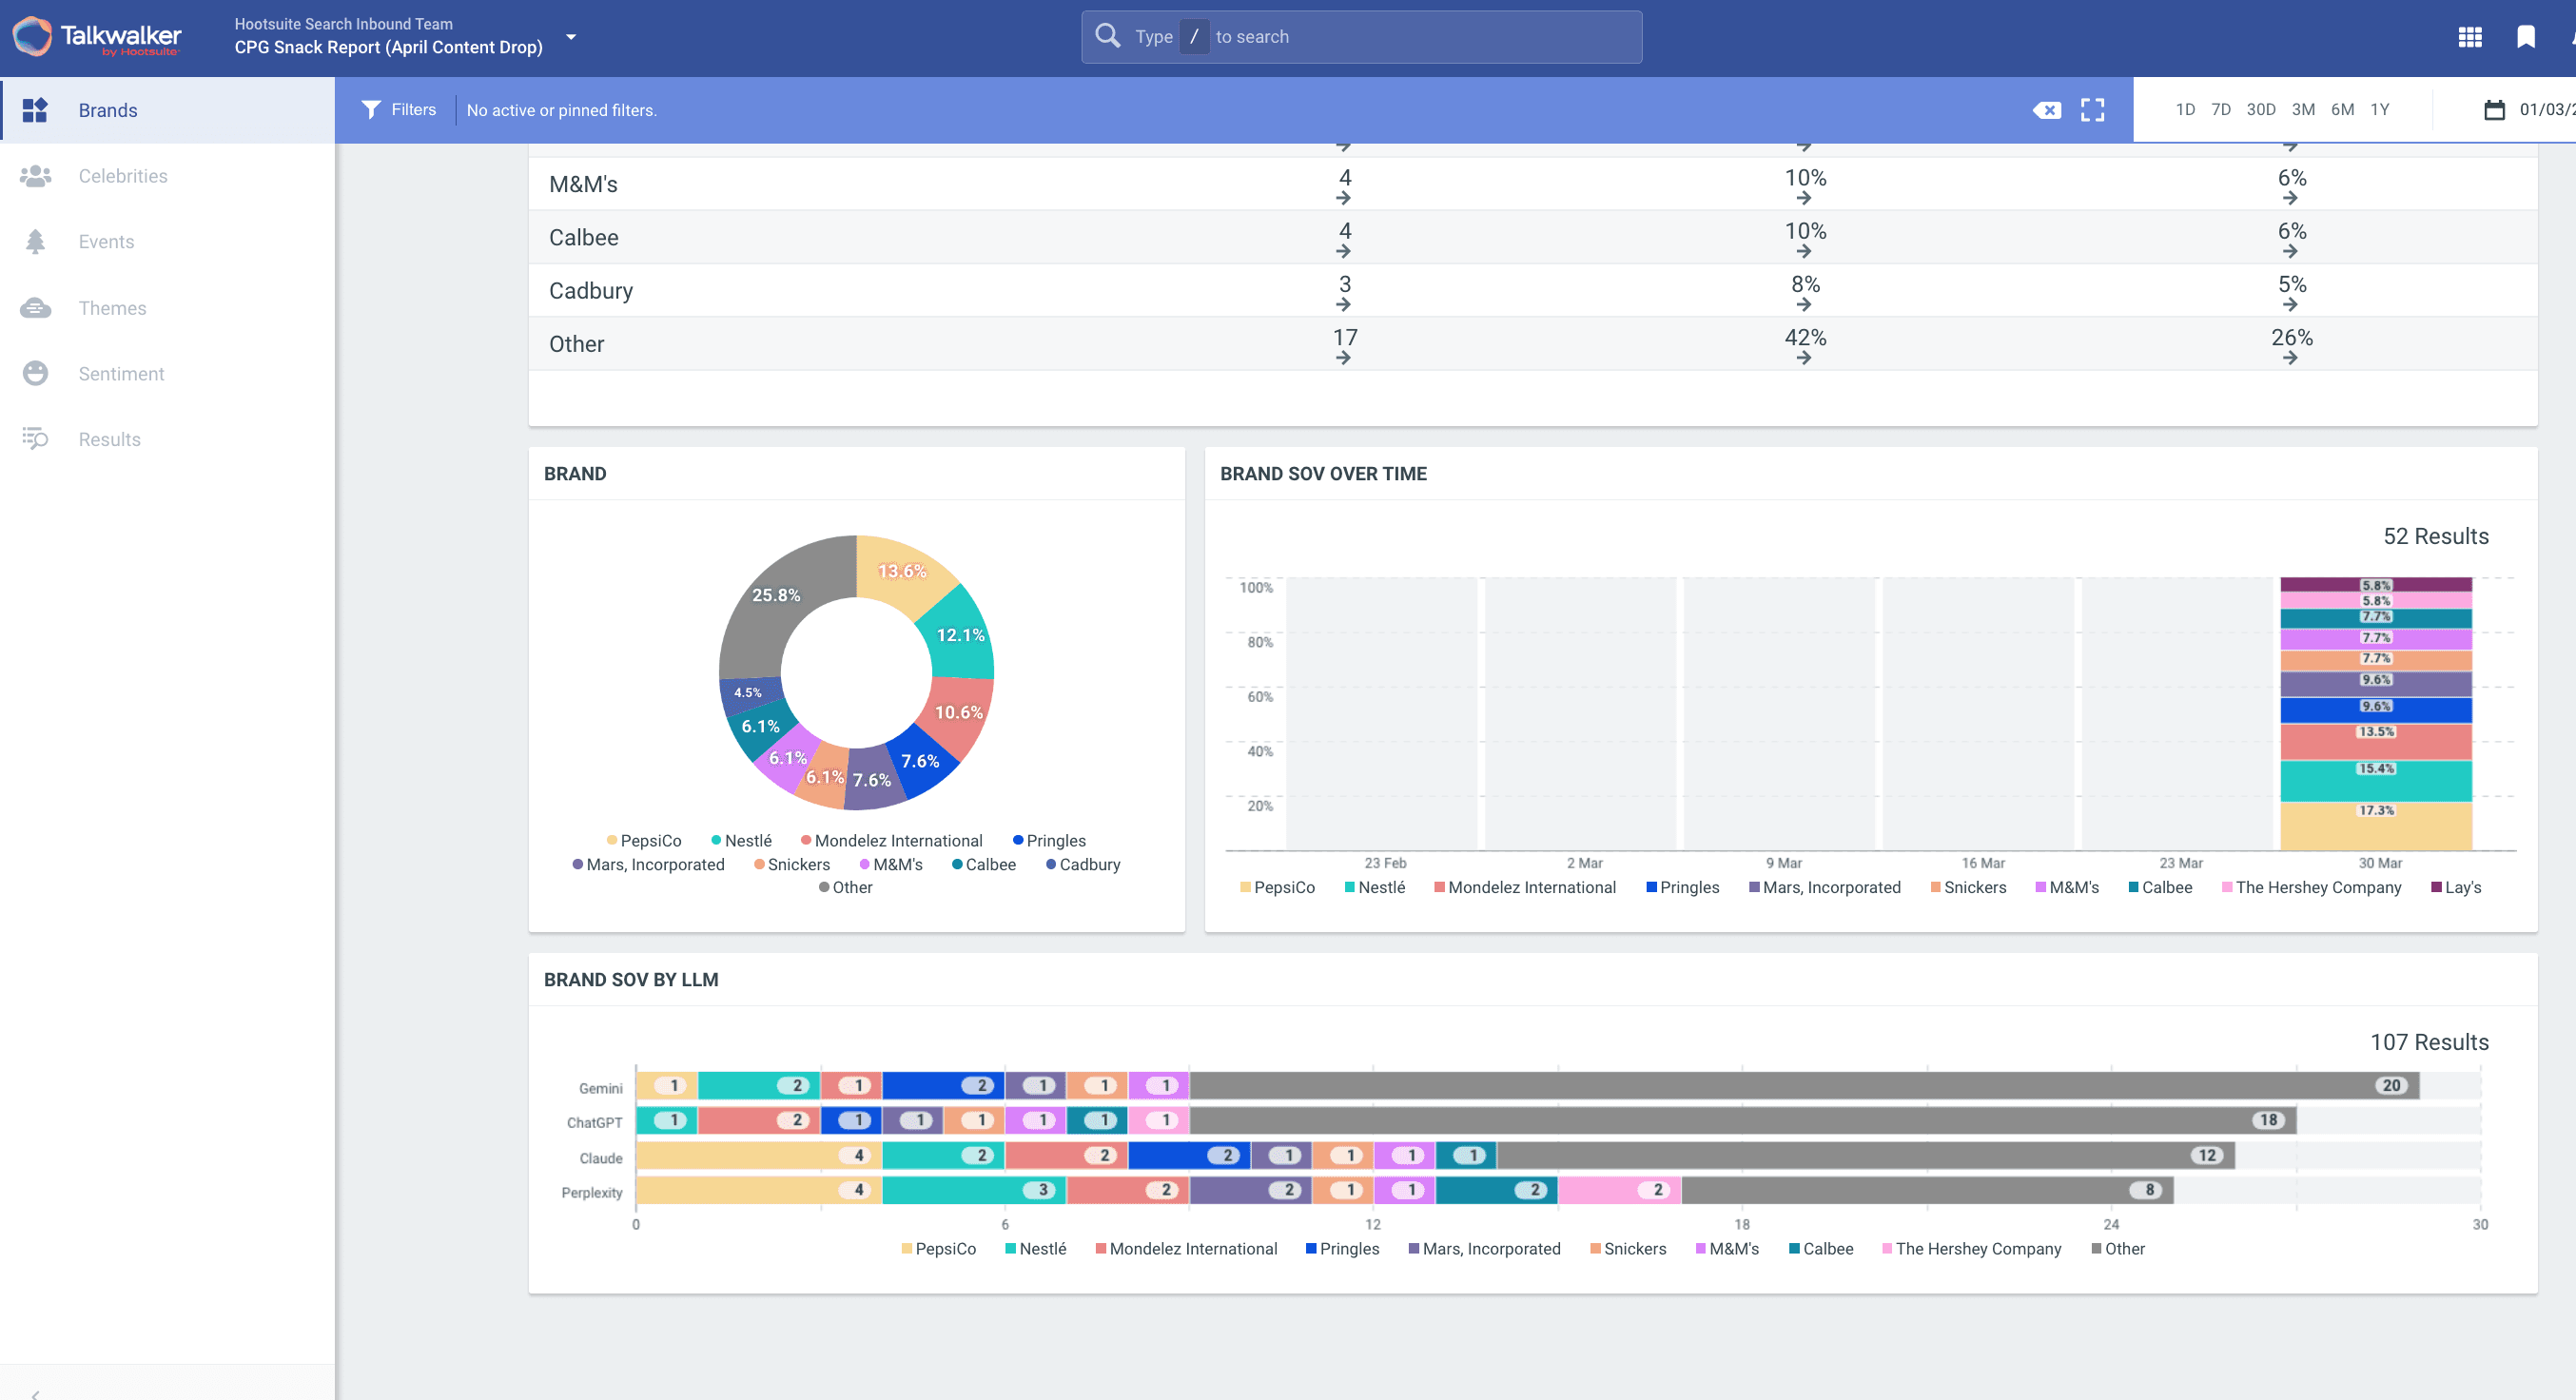
Talkwalker’s LLM Insights module measures how ChatGPT, Gemini, Perplixity and Claude answer consumer questions about your topics, so that you can get a sense of what information from across the internet is being synthesized and prioritized. This is especially helpful for reputation monitoring, as it gives you insight into whether your brand is being mentioned positively, unfavorably, or not at all.
You can access LLM Insights from the main homepage. To create a new channel or search, go to Settings > LLM Channels and select + New channel. Name your channel, then click +Add prompts and select from a library of prompt templates that cover use cases like brand monitoring, competitor intelligence, product feedback, market trends, and crisis detection — or write your own custom prompts.
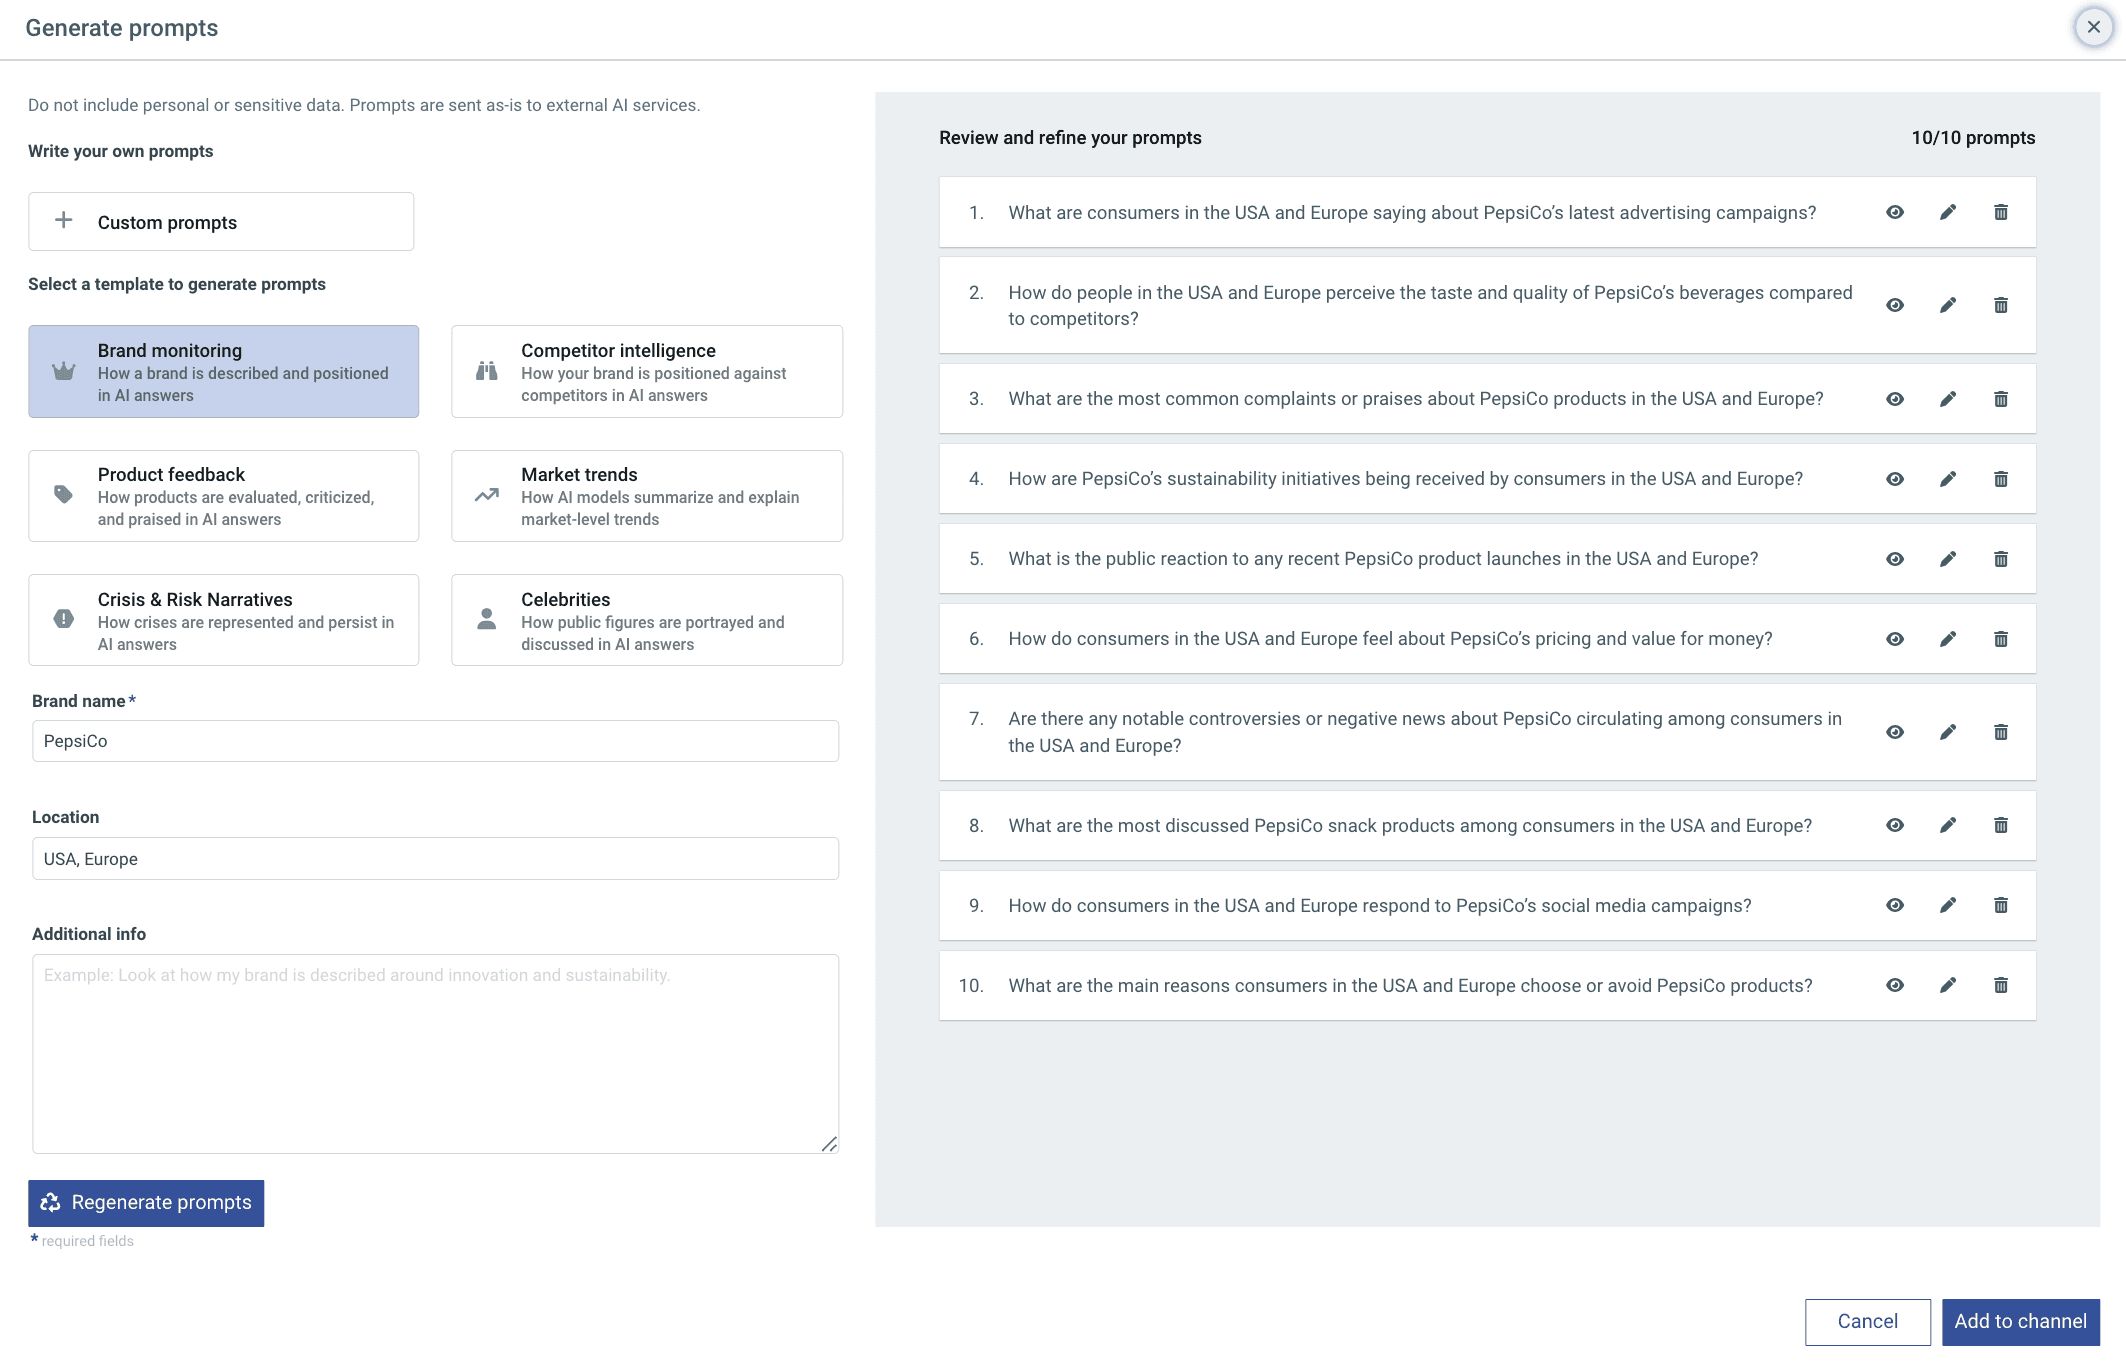
You can also edit, regenerate or write your own custom prompts (note that they max out at 10). When you’ve polished your prompts, Talkwalker will send them to Gemini, Claude, Perplexity and ChatGPT, and analyze the responses with the following LLM-specific metrics:
Mention rate: how often your brand appears in relevant AI responses
Average position: where your brand sits in AI-generated lists and comparisons
Visibility score: an aggregate view of your presence in AI-generated answers
Narrative and sentiment tracking: what the AI says about you, and whether it's favorable
Hallucination detection: flags when AI models generate inaccurate information about your brand
Evolution tracking: monitors how AI-generated perception changes as models are updated
The resulting reports can be found in your LLM Insights dashboard:
Step 6: Set up reports, dashboard, and alerts
This last step is where we take all the intelligence insights gleaned above and set up simple, recurring systems that ensure the right people get the information they need at the right time.
Ready-to-use predefined dashboards
IQ apps are a one-click overview of relevant data. Each template is designed for a specific use case (e.g., brand listening, crisis monitoring, trend analysis), and while you can immediately see actionable insights by selecting your topic or brand, you can also modify them as needed and add them to your own dashboards.
To access, select IQ Apps on the homepage, select your use case, and then select the relevant topics, channels or filters.
Custom dashboards
With a little bit more time, you can create a new dashboard with custom widgets that slice, filter, and visualize your data to match your needs.
On the dashboard homepage, select + New dashboard. Within your new dashboard, use the widget wizard to design charts, tables or KPIs using your preferred source, and set filters and comparisons for custom analysis.
Don’t forget that you can add useful charts from your IQ Apps or external sources to your dashboard as well.
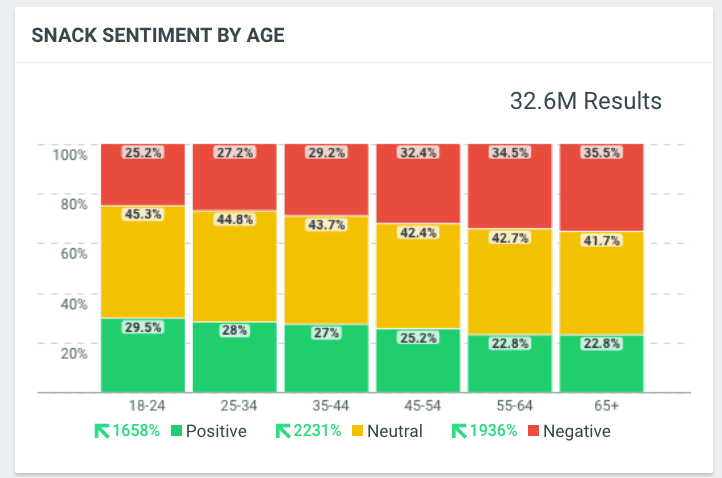
For the What Snackers Want Report, we built custom widgets to dig deeper into hunches and questions, which is how we identified the significant correlation between sentiment and age group.
Export, schedule and share reports
Reports can be exported in PPT, PDF, XLS, or CSV — useful depending on whether you're briefing a leadership team, populating a spreadsheet model, or sharing raw data with another team. You can also schedule reports to be delivered by email on a weekly or monthly cadence, so stakeholders receive consistent updates without having to log in.
For stakeholders without platform access, you can generate a shareable dashboard link with configurable options: refresh frequency, expiration date, and password protection. It's a practical solution for briefing agency partners, external consultants, or executives who need visibility without needing a full account.
Real-time alerts
Monitoring your dashboards shouldn’t be a full-time job. Free up your focus by setting up alerts (over email, Slack, Teams, Google Chat or in-app) when something significant happens. Talkwalker’s alerts cover a wide range of scenarios:
Volume threshold: a set number of new mentions is reached
Sentiment shift: negative (or positive) sentiment crosses a threshold
Viral post: a single piece of content takes off
Irregular activity: unusual patterns that don't fit historical norms
Engagement trend: significant movement in likes, shares, or comments
Most charts or data visualizations in your dashboards or IQ Apps include an option to Add to report or alert in the upper-right corner. Choose the alert type and configure your trigger conditions. Smart Spike, in particular, will use AI to spot unusual activity as it happens.

Want to see what your category looks like? Talk to our team to see Talkwalker in action.