
Social listening
What Super Bowl LX audiences actually talked about (Social listening data)
From the halftime show to brand performance, Super Bowl LX generated massive online engagement. Explore the social listening insights that reveal what resonated most with global audiences.
February 11, 2026
- Methodology
- A Super Bowl shaped by conversation beyond the game
- The halftime show as the most discussed moment
- What positive sentiment was actually about
- Where negative sentiment concentrated, and why
- The game was still central to engagement
- Brand performance: who generated positive attention
- Who engaged — and how audiences differed
- What Super Bowl LX reveals about modern attention
- Strategic takeaways for marketers
Super Bowl LX was more than a championship game. It was a cultural moment where sports, entertainment, and brand storytelling competed for the attention of a global audience. And the way people responded across social networks offers clear lessons for marketers and analysts.
In this post, we break down the social listening data to show what actually drove attention, what sparked the strongest reactions, and which brands came out ahead. If you want to understand what truly resonated beyond the broadcast, the insights start here.
Methodology
We used Talkwalker to track how online audiences and publishers across 150+ million sources (social networks, websites, blogs, news sites, forums, and more) have been talking about Super Bowl LX. We analyzed the volume and sentiment of mentions over time as well as theme clusters that developed around the topic.
You can easily do similar in-depth research on your brand, competitors, or industry. Book a free Talkwalker demo today.
A Super Bowl shaped by conversation beyond the game
Super Bowl LX demonstrated how far the event has evolved from a single-night sports spectacle into a multi-day, multi-platform cultural moment. While the game itself remained central, social discussion extended well beyond gameplay, touching entertainment, fan experiences, and broader cultural milestones.
The data shows that audiences didn’t engage with one unified narrative. Instead, conversation clustered around several parallel storylines, each attracting different demographics, regions, and sentiment profiles. Rather than diluting attention, this fragmentation expanded it.
From a social listening perspective, Super Bowl LX functioned less like a single broadcast moment and more like a collection of overlapping live events, each resonating with different audiences for different reasons.
The halftime show as the most discussed moment
The halftime show emerged as the most visible and emotionally charged focal point of Super Bowl LX’s social media conversation.
Bad Bunny’s performance marked a historic milestone as the first solo Latino and Spanish-language dominant halftime show. The performance generated extensive cross-platform discussion, fueled by its scale and its departure from the traditional halftime formula.
Digitally, the impact was undeniable. The performance reached 135.4 million viewers and accumulated 48 million YouTube views within 24 hours. In the U.S., Bad Bunny’s Spotify streams increased by 470% following the show. These figures underscore how the halftime show extended far beyond the live broadcast into sustained, platform-native engagement.
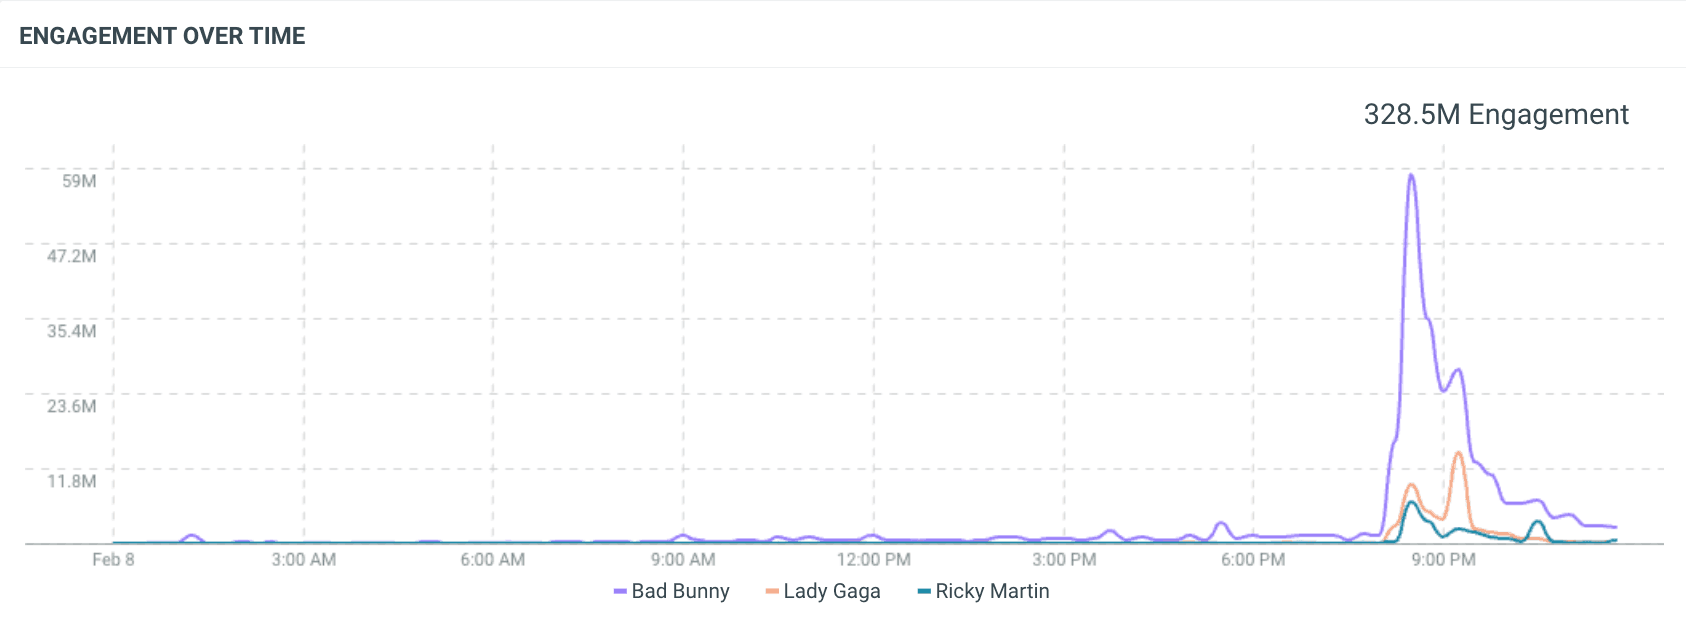
Online engagement with topics related to Halftime Show performers on February 8, 2026; Source: Talkwalker
At the same time, conversation around the performance reflected sharply divided reactions. While many users highlighted the energy, production, and historical significance of the show, others expressed dissatisfaction or discomfort with the departure from previous halftime formats. Rather than tapering engagement, this divergence fueled continued discussion in the days before and after the event.
From a listening standpoint, the halftime show illustrates a recurring Super Bowl pattern: the most culturally distinct moments tend to generate both the highest attention and the strongest emotional responses.
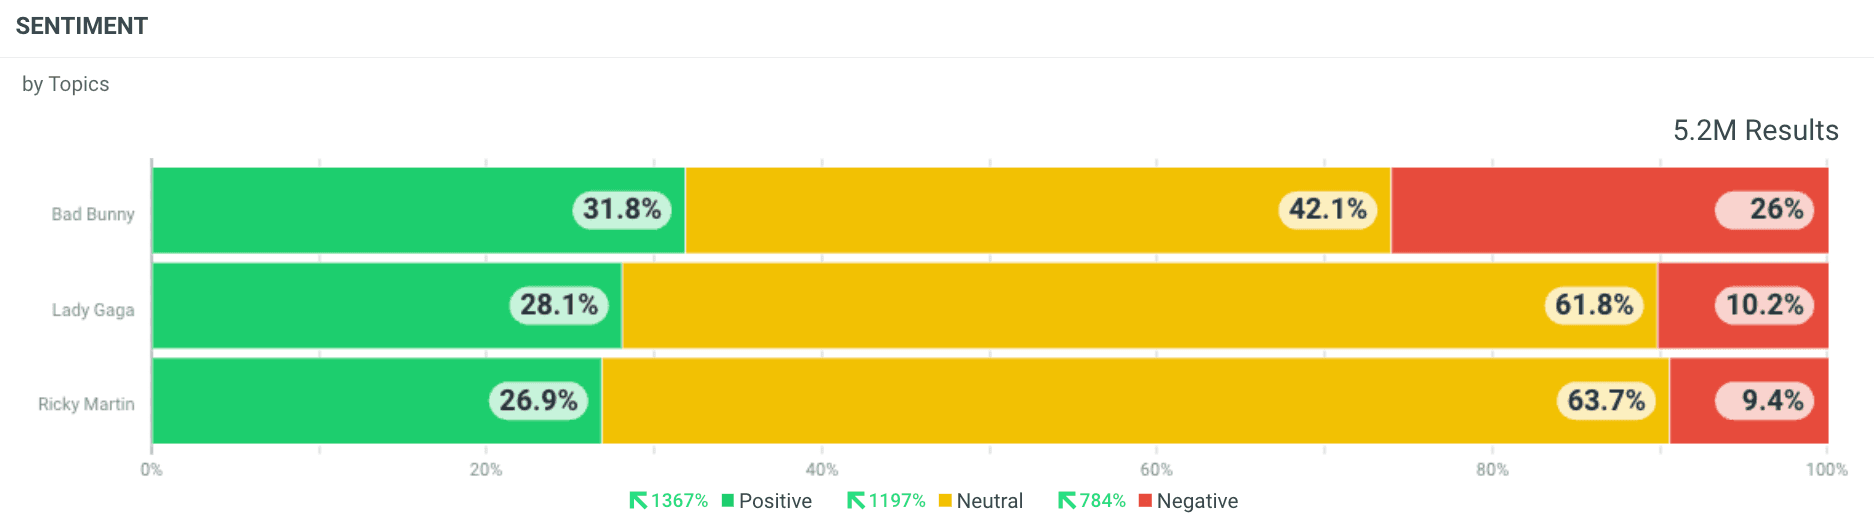
Sentiment breakdown for Super Bowl LX Halftime Show performers; Source: Talkwalker
What positive sentiment was actually about
Despite the visibility of controversy, positive sentiment dominated many areas of the Super Bowl LX conversation — and it wasn’t driven primarily by spectacle.
The single largest driver of positive sentiment was Teamwork & Leadership (Patriots & Seahawks), generating 156,301 positive mentions. This far exceeded all other tracked topics, including the halftime show.
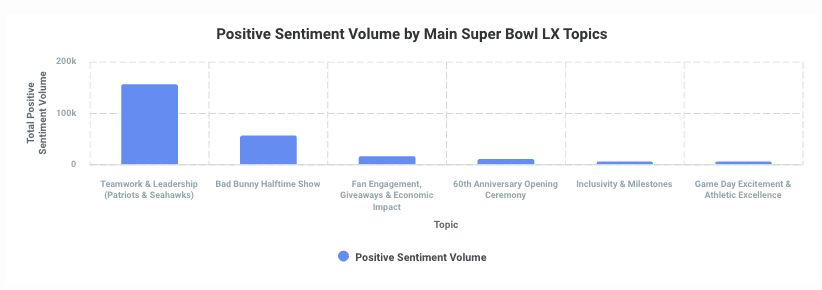
Source: Talkwalker
Fans consistently responded to narratives centered on resilience, mentorship, and personal growth. The Seahawks’ postseason run without a turnover (a first for a championship team) became a key talking point. Sam Darnold’s resurgence drew widespread attention, while the Patriots’ leadership culture and team traditions resonated strongly with audiences.
The halftime show ranked second in positive sentiment volume, with 56,649 positive mentions. While significant, this was less than half the volume generated by team-centric narratives, reinforcing that sports storytelling still anchors the emotional core of the Super Bowl experience.
Other contributors to positive sentiment included:
Fan engagement, giveaways, and economic impact (17,152)
60th Anniversary Opening Ceremony (11,588)
Inclusivity and milestones (5,433)
Game day excitement and athletic excellence (5,326)
The data suggests that audiences responded most positively to moments that felt authentic and earned — particularly those tied to team dynamics and shared celebration.
Where negative sentiment concentrated, and why
Negative sentiment was not evenly distributed across topics.
The Bad Bunny halftime show accounted for the highest volume of negative sentiment by a wide margin, peaking at 170,027 negative mentions on February 10, 2026. Smaller but consistent spikes occurred on February 2 (32,356), February 3 (38,514), February 7 (42,103), and February 9 (57,189), indicating sustained debate rather than a single-day reaction.
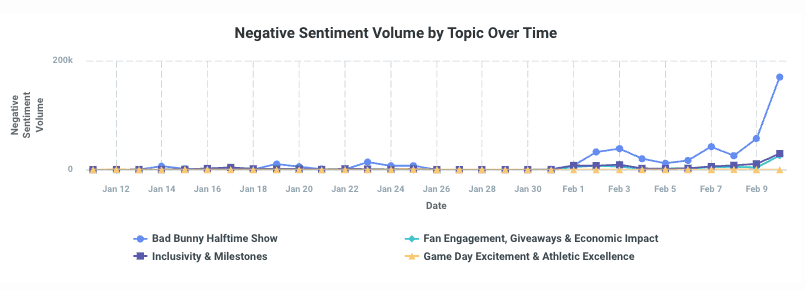
Source: Talkwalker
Other topics generated noticeably lower negative volumes:
Inclusivity and milestones peaked at 29,351
Fan engagement, giveaways, and economic impact peaked at 25,385
Game day excitement and athletic excellence peaked at just 107
Importantly, the data shows that negative sentiment did not suppress engagement. Topics with higher negative sentiment also sustained higher conversation volume overall, suggesting that disagreement and debate extended the lifespan of the discussion rather than curtailing it.
For marketers, this reinforces a critical insight: visibility and sentiment are not inversely linked. Moments that challenge expectations often generate longer, more sustained attention — even when reactions are mixed.
The game was still central to engagement
Although off-field moments dominated headlines, the game itself remained central to fan engagement, particularly through emotional storytelling.
The Seahawks’ defensive dominance and decisive victory over the Patriots fueled widespread discussion, but sentiment was shaped less by individual plays and more by broader narratives.
Kenneth Walker’s MVP performance and Sam Darnold’s career arc became focal points, while the Patriots’ unexpected return to the Super Bowl after missing the playoffs last season added depth to the storyline.
Sentiment analysis shows that Seahawks fans expressed consistently higher positive sentiment than Patriots fans, especially during key moments:
February 8: Seahawks 574 vs Patriots 525
February 10: Seahawks 288 vs Patriots 167
Patriots fans, meanwhile, recorded a higher post-game negative sentiment peak on February 10 (104 vs Seahawks’ 53), suggesting greater disappointment following the final outcome.
Neutral sentiment dominated for both fanbases throughout the period, highlighting a large audience engaged in observation, analysis, and commentary rather than emotional extremes.
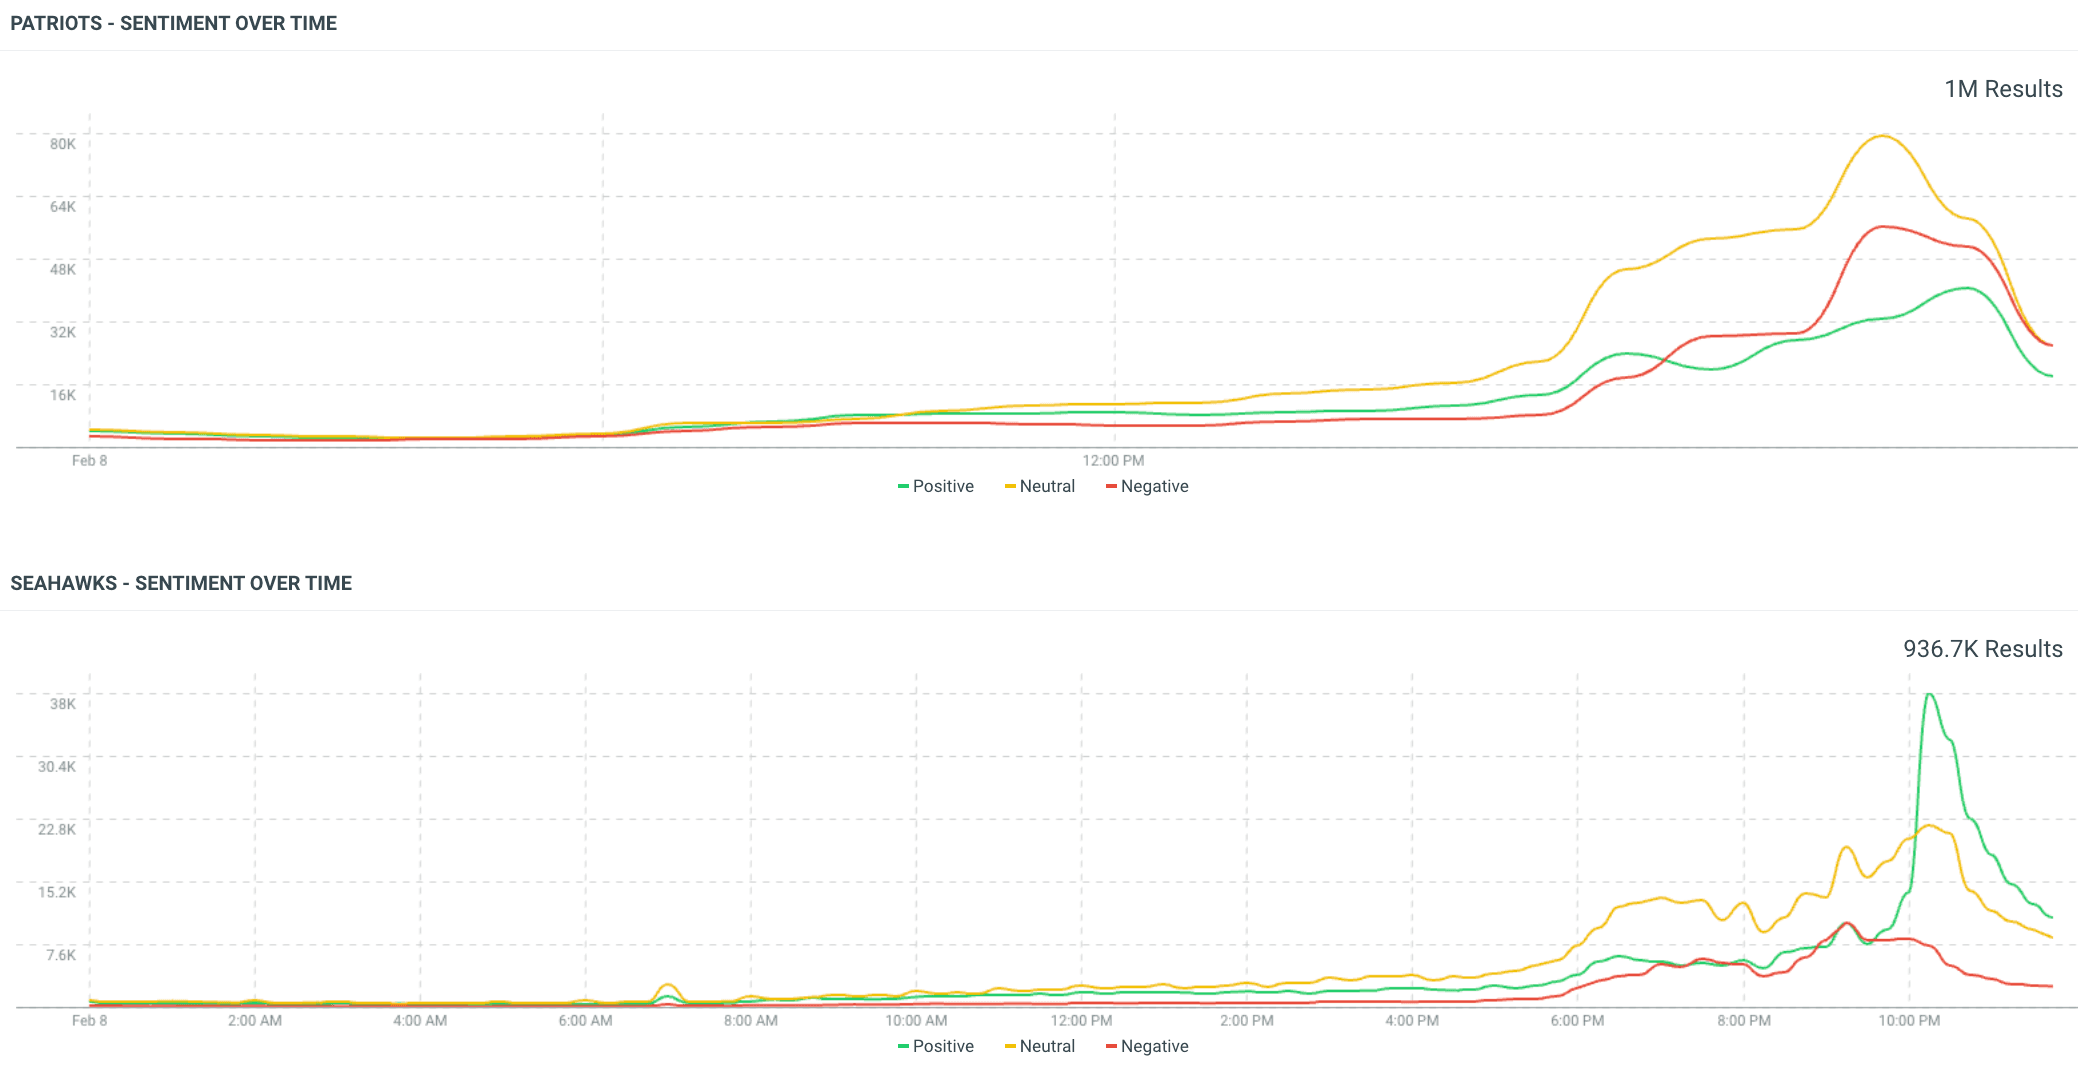
Source: Talkwalker; February 8, 2026
Brand performance: who generated positive attention
Super Bowl LX also delivered clear winners in brand sentiment.
DoorDash led all brands with 12,531 positive mentions, far surpassing every other advertiser.
Other strong performers included:
Budweiser: 1,349
Lays: 1,077
Bud Light: 1,032
Instacart: 436
Doritos: 389
Lower-volume performers included Bosch (150), HexClad (109), Hims & Hers (80), Nerds (78), Novartis (70), RITZ (25), and Hellmann's (3).
Across the board, brands that generated positive sentiment tended to align with familiar Super Bowl patterns: emotional storytelling, humor, and high production value. The data suggests that while innovation matters, clarity and audience familiarity remain powerful drivers of positive reception.
Who engaged — and how audiences differed
Gender
Over 60% of online conversations surrounding the sports event itself were driven by audiences identifying as male.
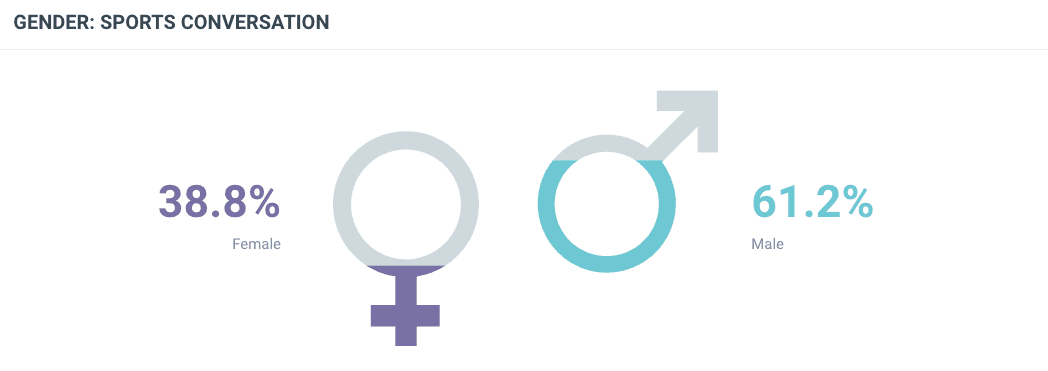
Source: Talkwalker
In contrast, the halftime show attracted a more balanced gender split, with female-identifying audiences contributing to 46.9% of all online conversations.
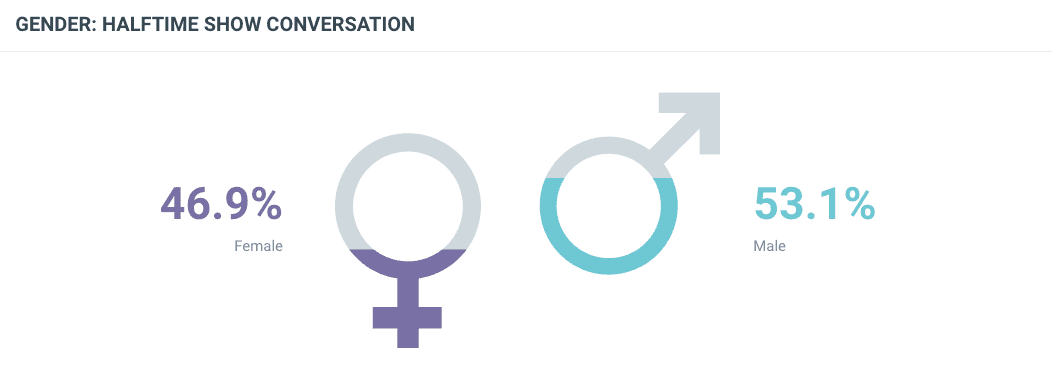
Source: Talkwalker
Sentiment followed a similar pattern. Men generated the highest volume across positive, neutral, and negative categories, but women contributed substantial positive and neutral engagement, particularly around the halftime show.
Language
English dominated conversation overall (480,744 sports-related mentions), followed by Spanish (84,123). For the halftime show, Spanish participation increased proportionally, aligning with the performance’s cultural focus.
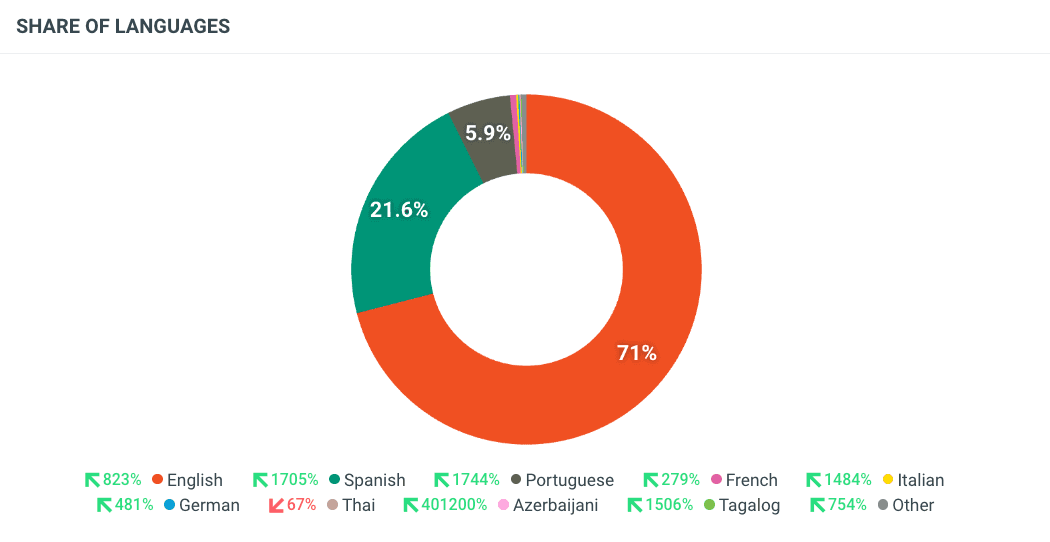
Share of languages in the Halftime Show conversation; Source: Talkwalker
Spanish-language sentiment showed strong positive engagement (15,000 mentions) alongside higher negative sentiment (7,000) than English, indicating more polarized discussion within this group. English-language conversation remained larger overall, with comparatively lower negative volume (5,000).
Region
North America led participation with 391,212 mentions, followed by South America (46,002) and Europe (39,715).
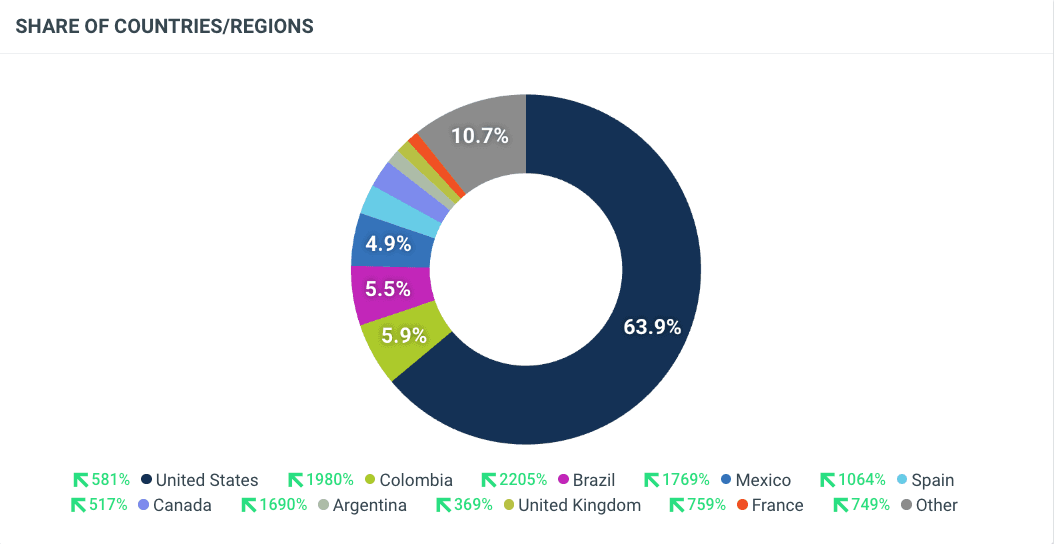
Source: Talkwalker
While North America showed the highest overall engagement and polarization, South America skewed more positive, particularly around the halftime show. Europe displayed steadier, largely neutral-to-positive sentiment, while Asia, Africa, and Oceania contributed smaller volumes with predominantly neutral engagement.
What Super Bowl LX reveals about modern attention
Several patterns stand out across the data:
Audiences engage deeply with narratives, not just moments
Emotional resonance often outweighs spectacle
Polarization increases conversation longevity rather than diminishing reach
Global and multilingual audiences shape engagement in measurable ways
Super Bowl LX illustrates how large-scale events now function as layered experiences, where different audiences engage with different aspects simultaneously.
Strategic takeaways for marketers
For brands and social teams, the implications are clear:
High engagement does not require universal agreement
Cultural relevance often comes with varied reactionsTeam- and human-centric stories drive the strongest positive sentiment
Social listening is essential for understanding why conversations evolve, not just how much they grow
By looking beyond surface-level metrics, marketers can identify which moments create lasting impact — and which simply pass through the feed.
Super Bowl LX wasn’t defined by a single storyline. It was defined by the sheer range of conversations it generated, across sports, entertainment, brands, and fan identity.
For marketers, the lesson is not to avoid complexity, but to understand it. Social listening reveals where attention gathers, where it fractures, and where it sustains — offering insight that traditional metrics alone can’t provide.
In a media landscape shaped by participation as much as viewership, Super Bowl LX offers a clear reminder: the real game often unfolds after the whistle.
If you found these insights useful, imagine what the same level of analysis could reveal for your brand, competitors, or industry.
With Talkwalker, you can track real-time conversations across millions of sources, uncover sentiment trends, identify emerging themes, and understand exactly what drives audience engagement.