With leading AI and natural human search to get you to the Sports insights that matter fast.
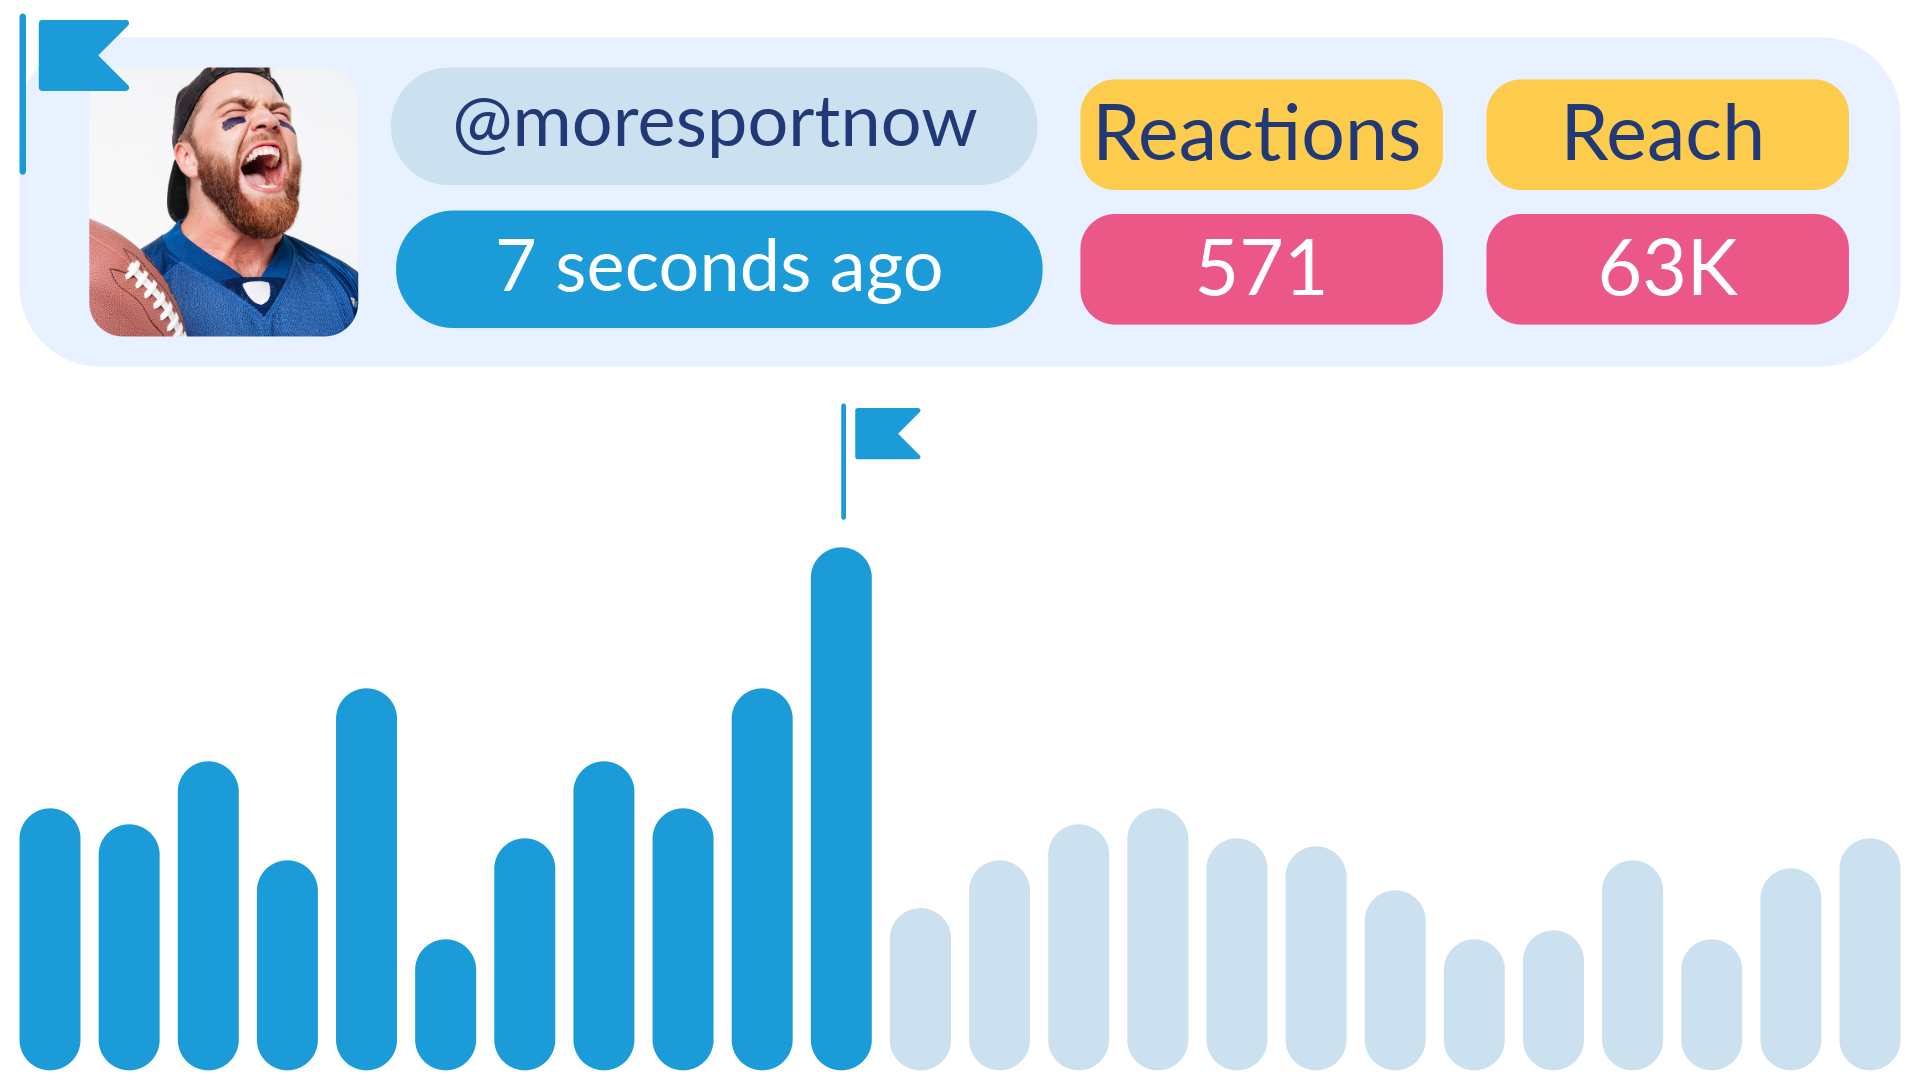
Game in real-time
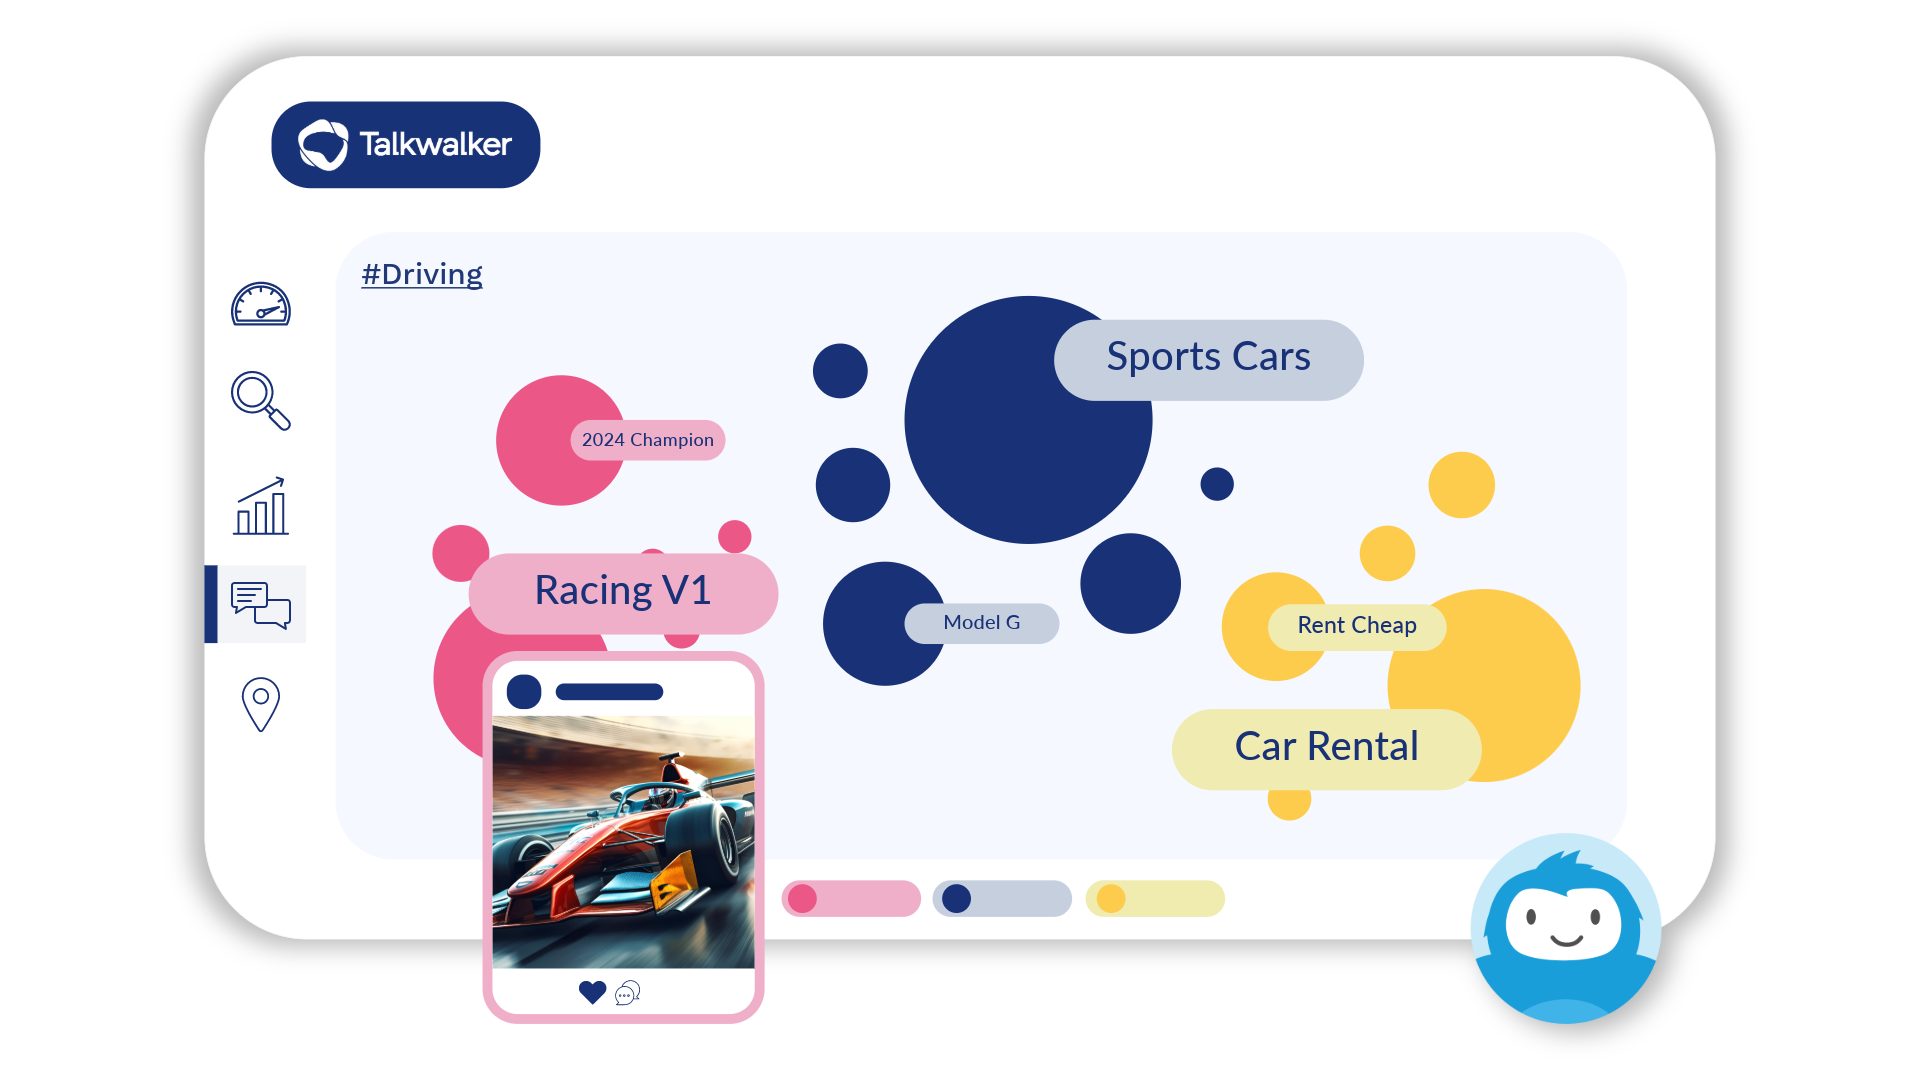
Gain insights into conversations, competitive analysis, and sentiment in real-time.
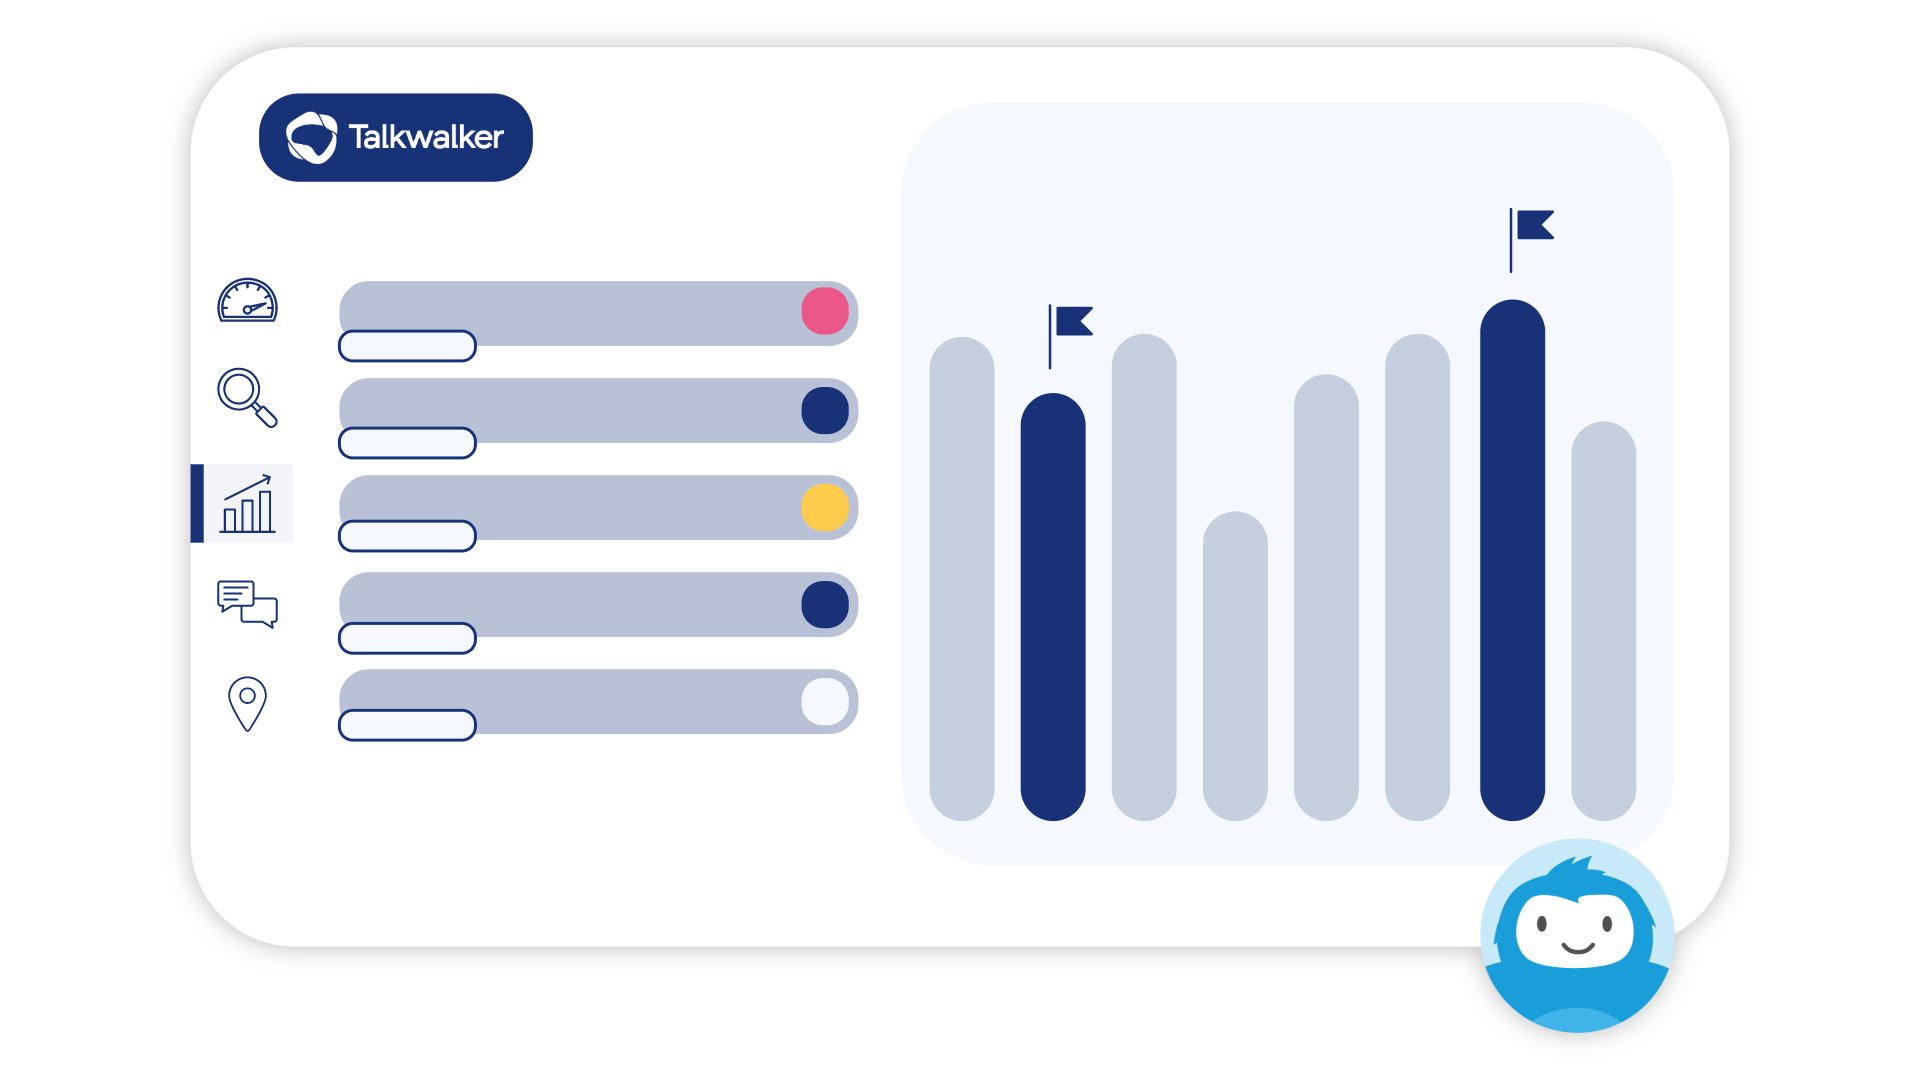
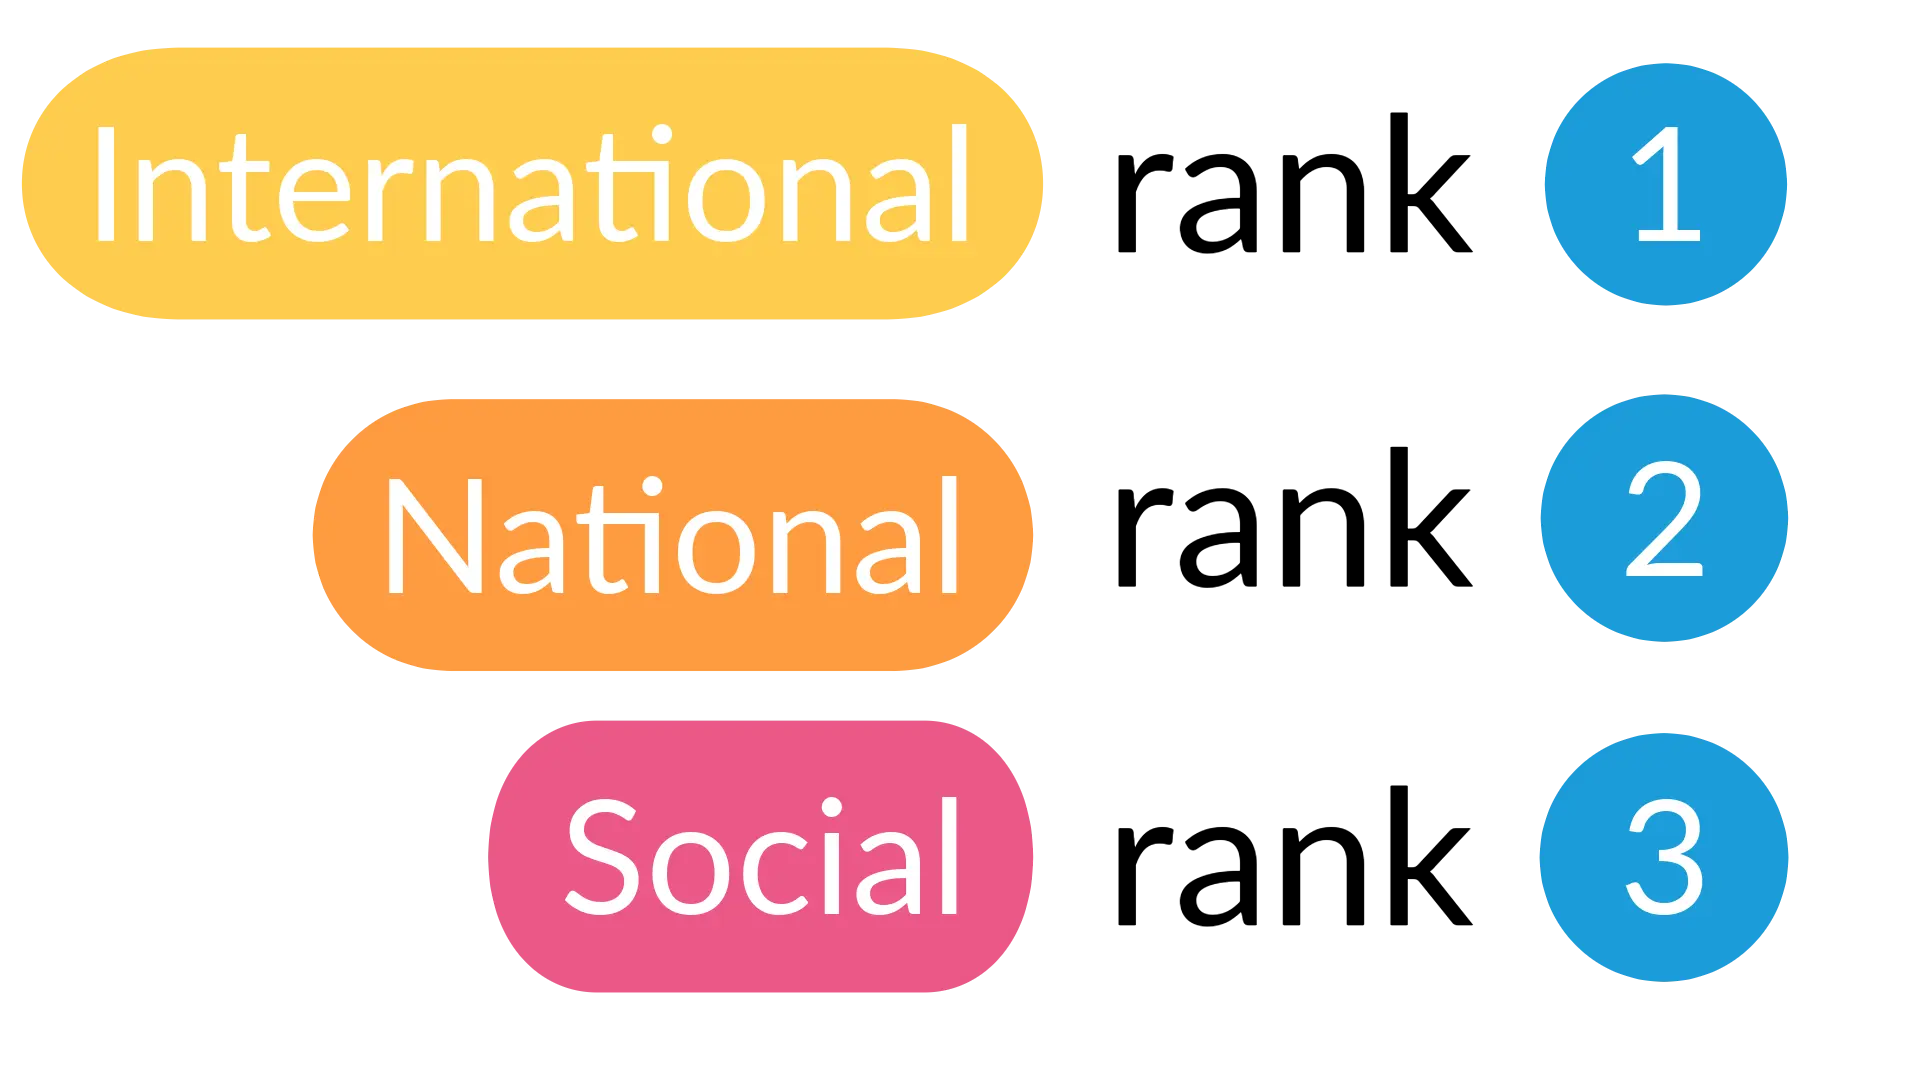
Custom Scoring
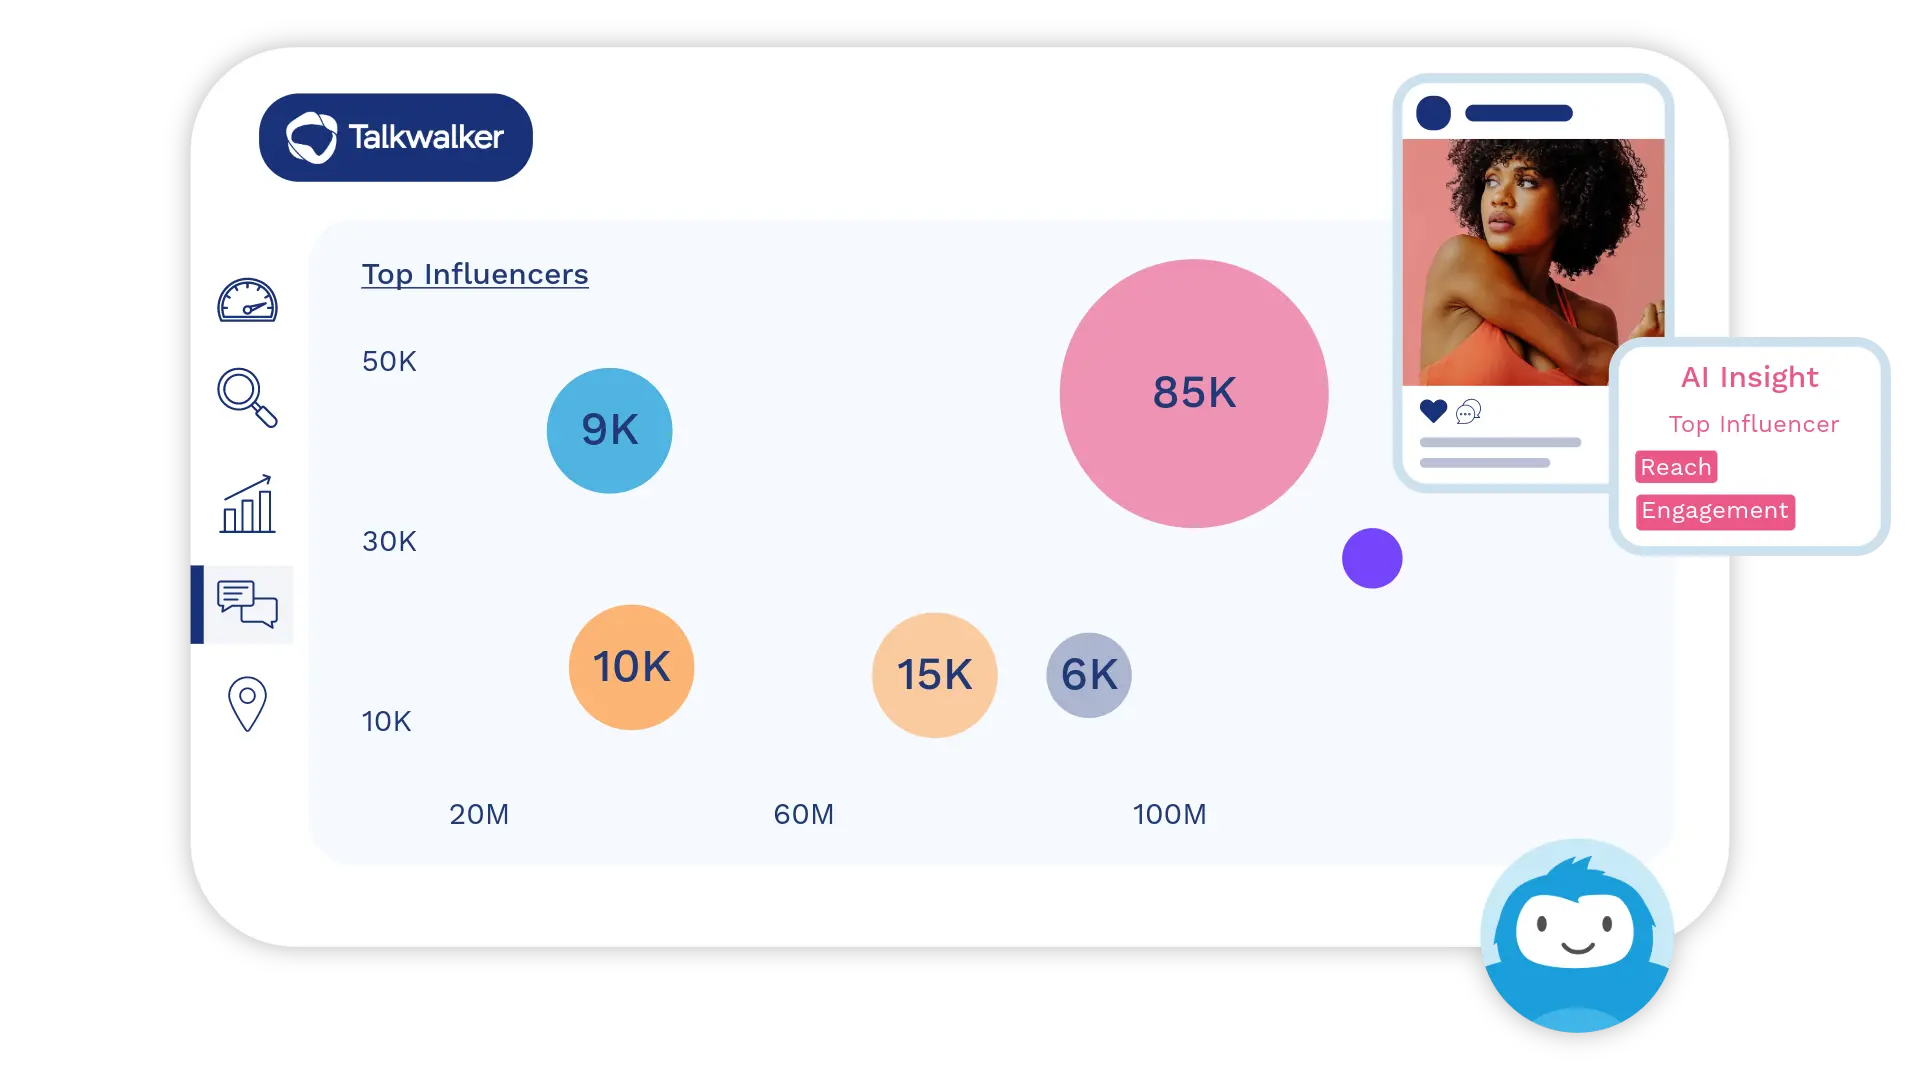
Accurately evaluate your media, and star influencers performance by adding and setting your scoring system directly in our platform.
Social Content Ratings®
Measure social engagement & video performance with the solutions trusted by the world’s best sports brands.
Work with experts
Our industry experts help and guide you every step of the way. We understand the Sports industry, and provide specialized solutions to meet your exact needs.
Recognize your brand
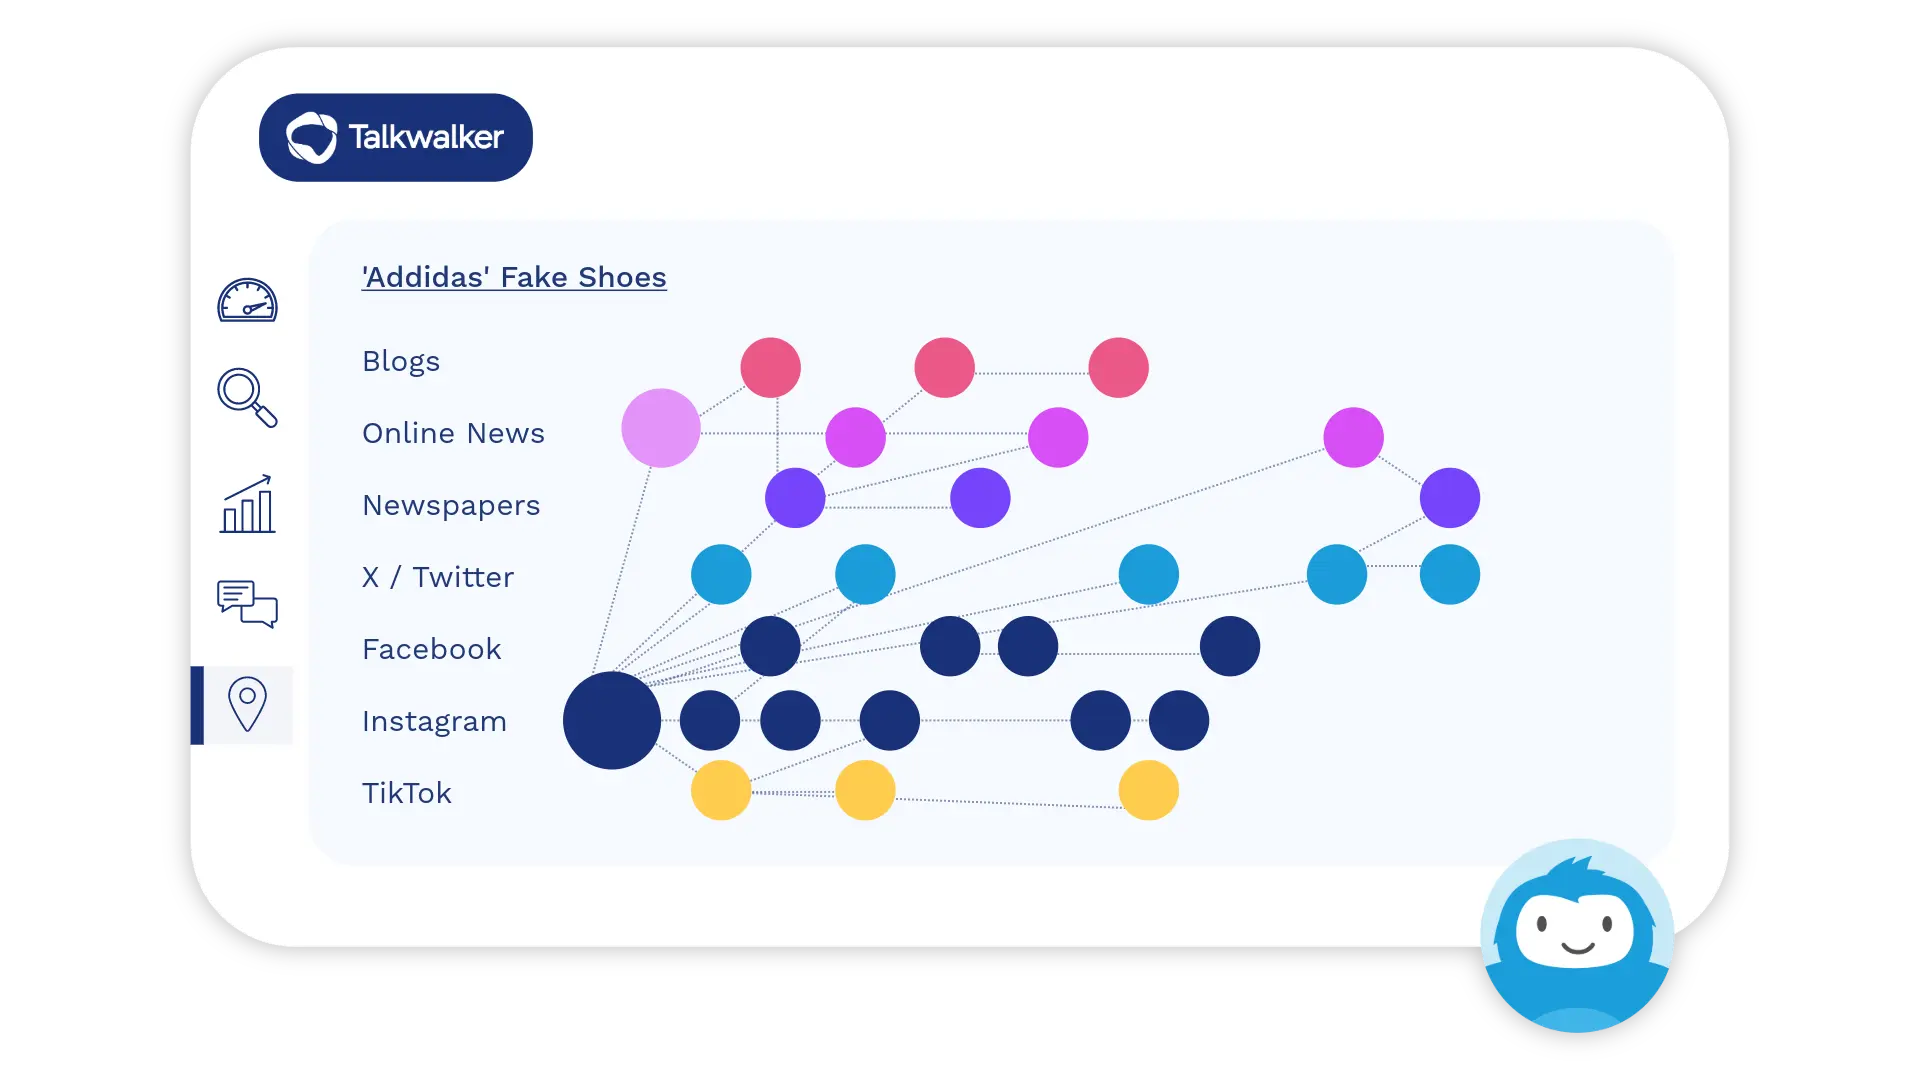
Leverage logo and OCR detection to capture owned and earned visual mentions of your brand and your sports partnership activations.
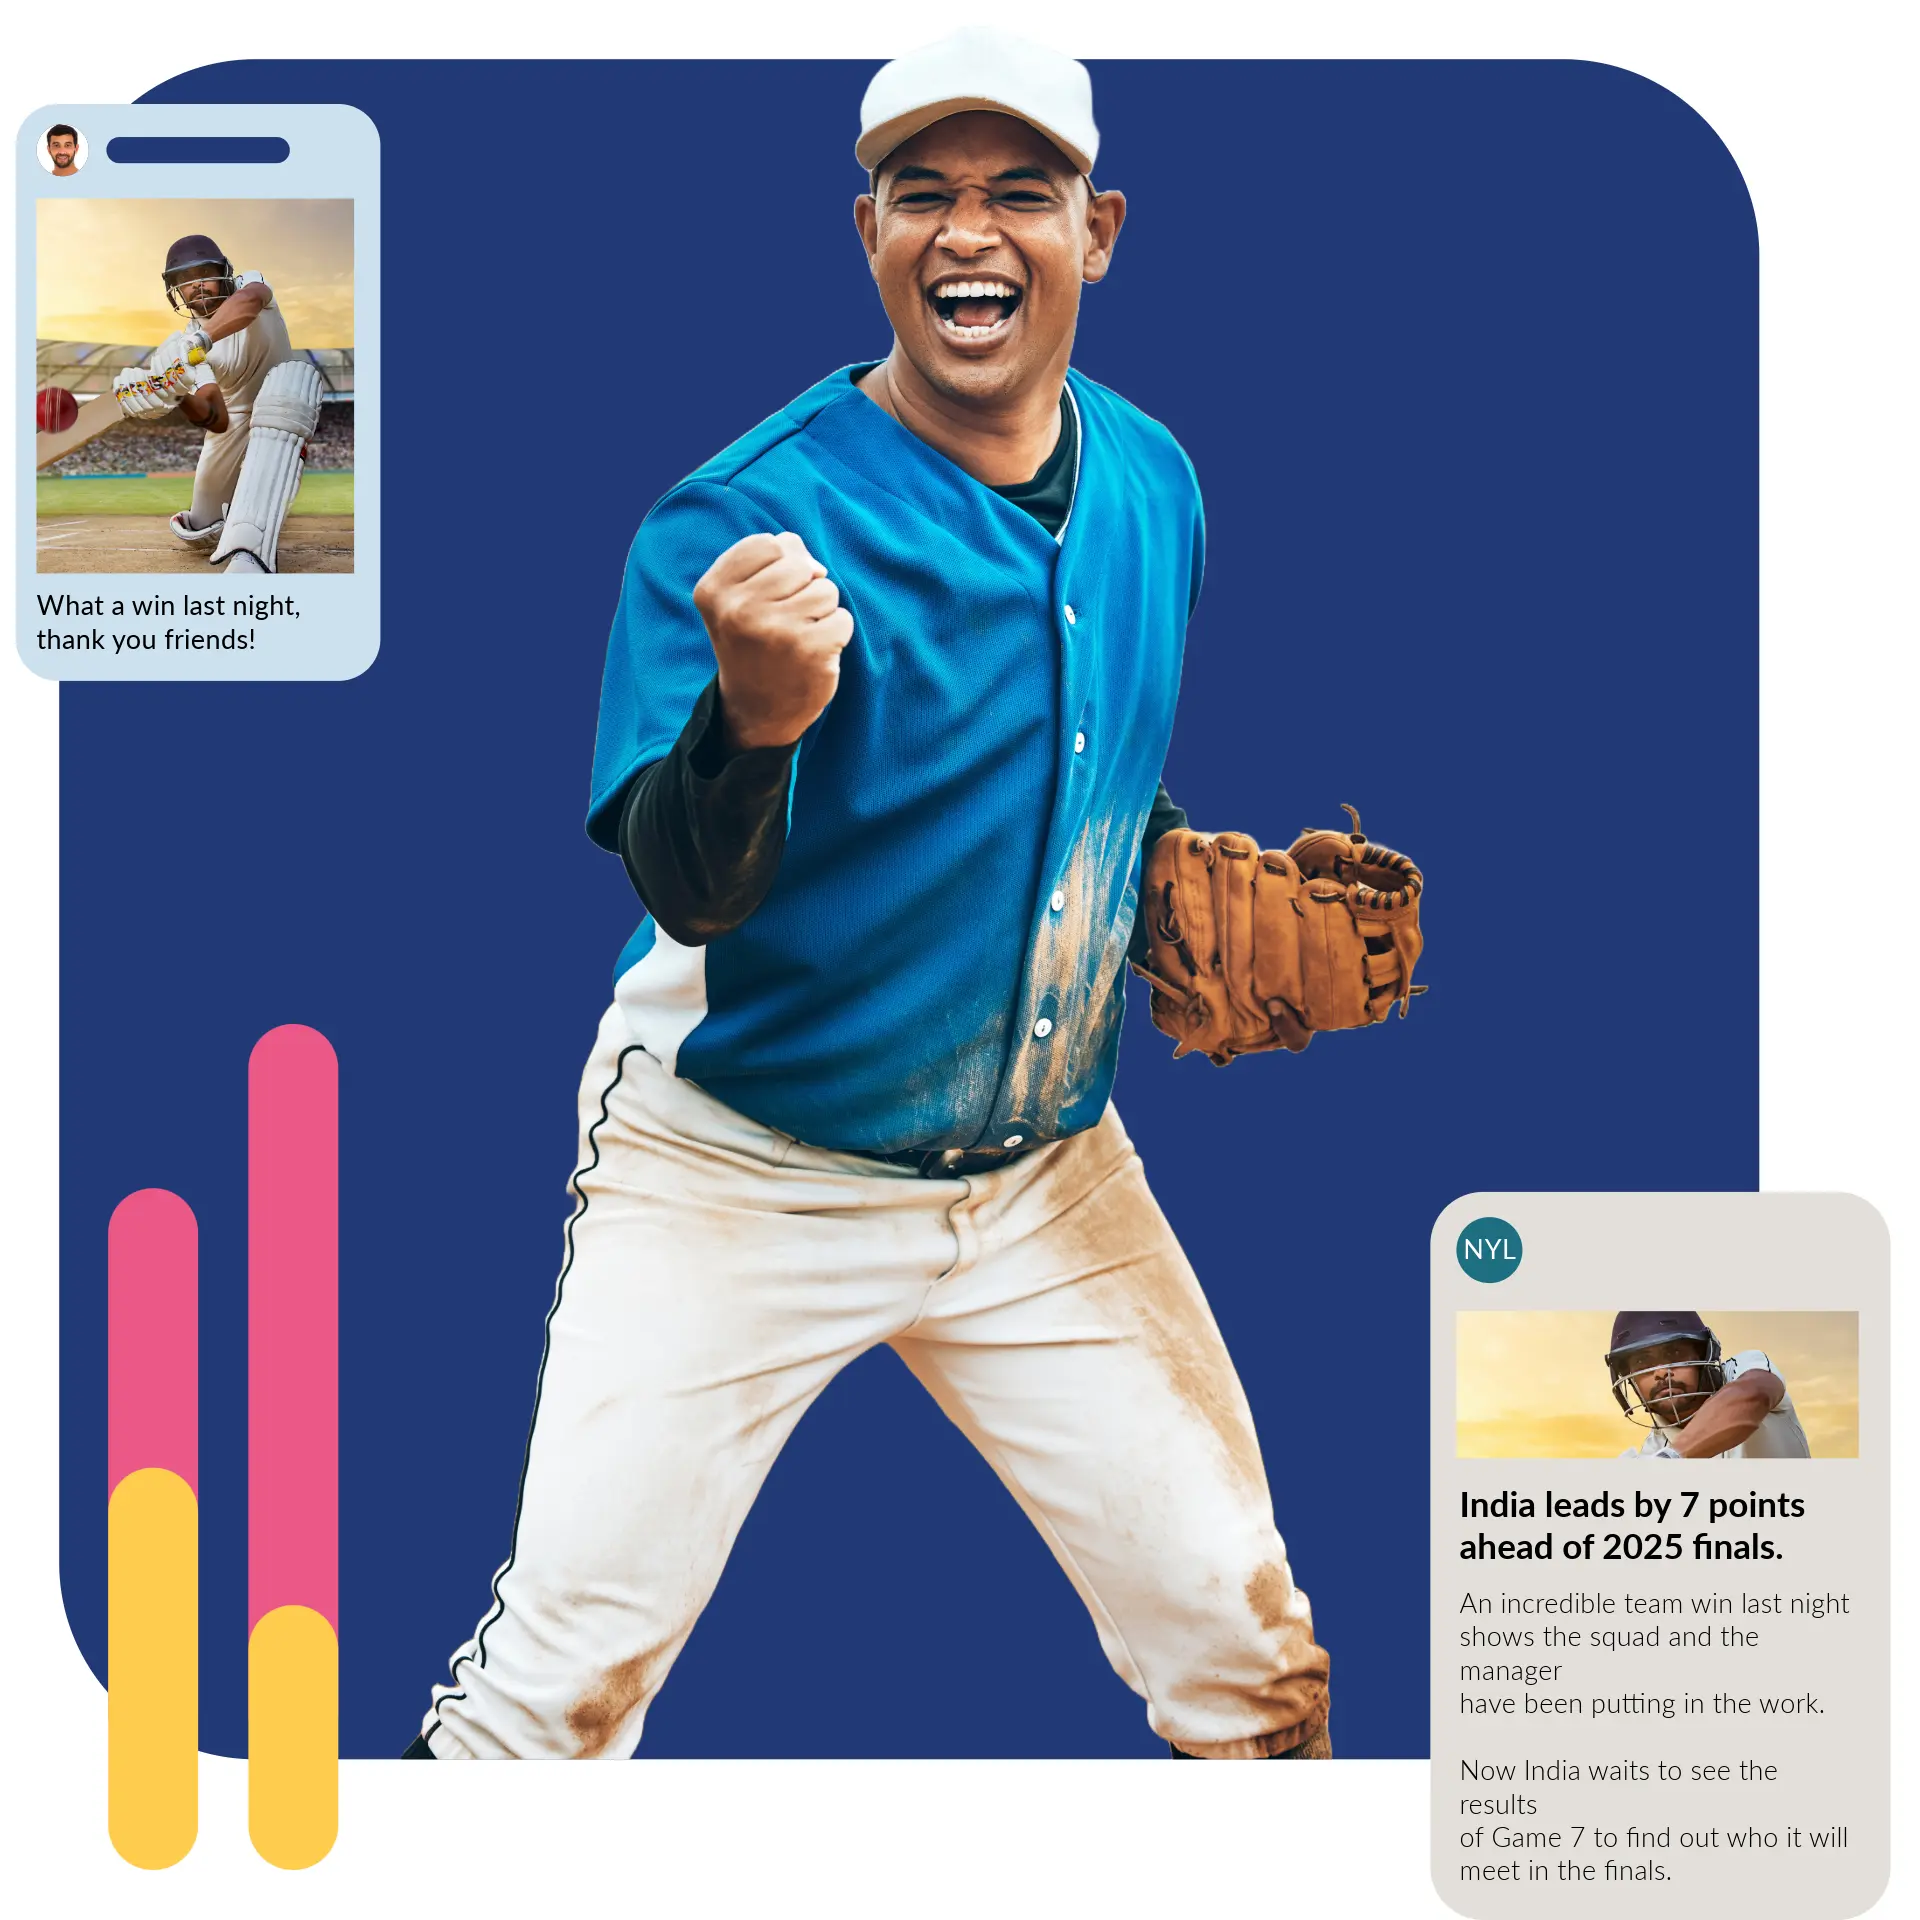
Understand your fans
Identify your superfans online, and build loyalty by leveraging the positive sentiment around your brand, products and services.
Sports Media
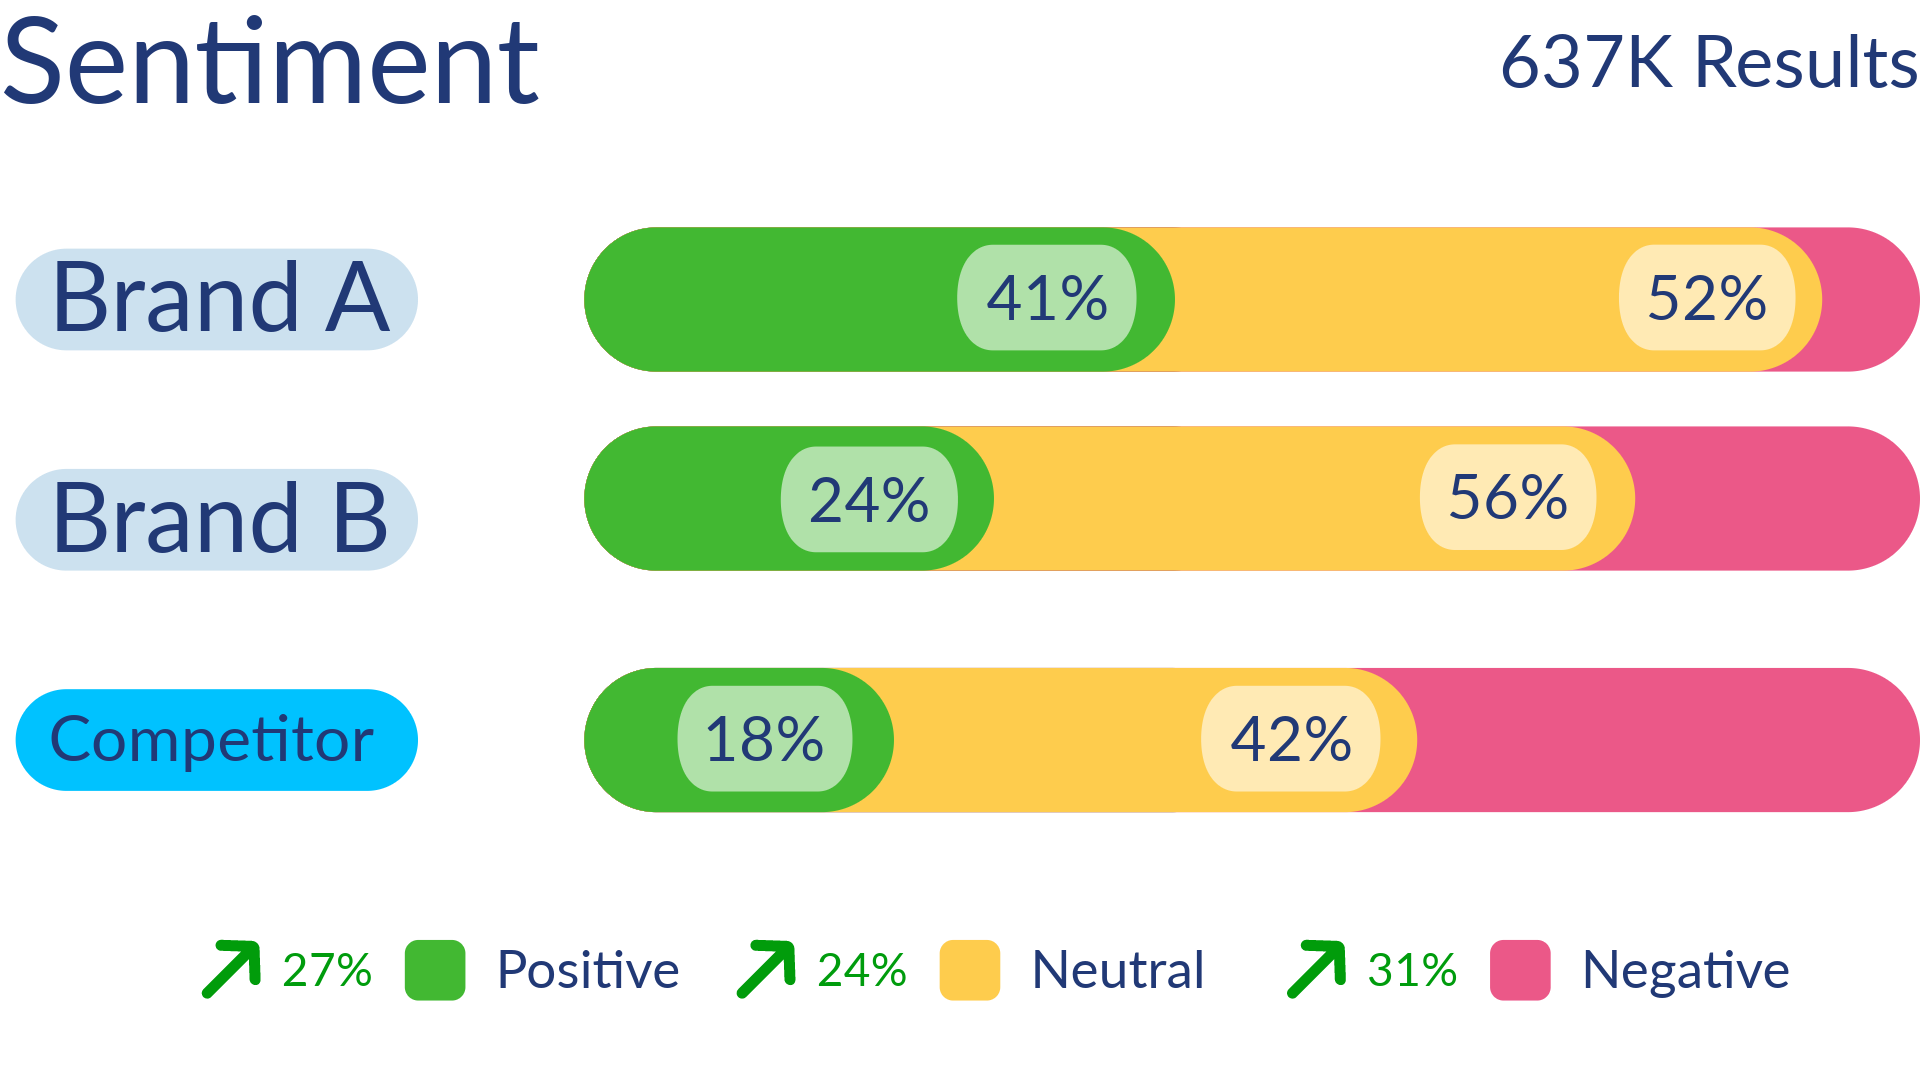
Understand the sentiment around programs, audience resonance, and trend spotting.
Social Content Ratings:Benchmark social performance around programming and talent accounts.
Sports Leagues
Track earned measurement: Gain insights into organic conversations, competitive analysis, and sentiment.
Social Listening: Leverage AI-powered Conversation Clusters, sentiment analysis, and custom filters for streamlined workflow and data analysis.
Sports Teams
Benefit from Talkwalker's affordable solutions, including Social Intelligence and Social Content Ratings, for social benchmarking.
Benchmark Partner Performance: Your partnerships are incredibly valuable , benchmark the performance across the US and European sports marketplaces, and track fan sentiment around them to tell powerful stories around your campaigns
Sports & Entertainment Agencies
Use Talkwalker to tell macro and micro stories about brand-sponsored campaigns in the global sports marketplace
Be an Insights MVP: With Talkwalker you are offering the most valuable insights, both quantitative and qualitative, powered by Next Gen Social Listening.
Brands
Identify the Right Sports Partner: Understand which sports properties are driving the most engagement, video views, and positive sentiment.
How Brad uses Talkwalker to transform his team's social strategy.
to maintain the team's social media presence and
ensure that their key players shine bright in the online world.
Real-time fan engagement
Talkwalker's real-time monitoring allows Brad to stay updated with fans' sentiments during and after each game and tailor messages.
Competitive analysis
Brad used Talkwalker to gain insights into the strategies of rival teams. This helps identify gaps and opportunities for the Hotspeakers' social media campaigns.
Player protection and promotion
The Hotspeakers have superstar athletes, and Brad ensures that the players' online personas are always positive, relatable, and in tune with fan expectations, to protect their advertising value.
Crisis management
Talkwalker's crisis alert feature provides Brad with instant notifications, enabling a swift and effective response to mitigate any reputational damage.
About this example
The adoption of Talkwalker in the fictional Tolodo Hotspeakers' would yield impressive results. Imagine what it could do for your brand.


.png)

.webp)
.png)